Chapter 11 Experiment: Arduino
I argue there is another revolution going on, and it is the one that has to do with the open-source hardware and maker’s movement. – Massimo Banzi
In the first step, establish that the components work and interact in a controllable way. Therefore, the first part of the experiment will introduce you to the micro-controller and how it is programmed using the Arduino language. In the second part, you will perform a typical physics experiment using the Arduino components and sensor to efficiently and accurately collect data. The proposed experiment has to do with heat absorption of two objects made of the same material, but different color. If possible, you should add an extension to the experiment that would solidify our physics knowledge.
11.1 First Steps
If you are not familiar or only minimally with the Arduino micro-controller, then follow this exercise. In this introduction project, connect a resistor and LED in series. Make sure that the LED’s polarity is connected properly. Also make sure - see earlier discussion - that you choose the correct resistance. Use Pin 12 to control whether the LED is on or off. Simply connect the positive end of the LED to Pin 12 and the end of the resistor to the ground (GND). Note that you will break the LED, if you connect the negative end to the ground as you would then provide 5 V to a LED, which operates on about 2 V; that is the reason for the resistor.
Now, use the code to set Pin 12 to either a high state (5 V), or a low state (0 V); since in the low state, there is no potential difference, there the LED will be off. Copy the code from Listing ??.
Arduino programming language is similar to the C language. The programs are very small and the commands are limited. If you are know programming, it will be easy to learn, and if you are new to programming, this may be an ideal introduction due to its limitations. In the text here, we will assume no or very limited programming knowledge.
The Arduino software is open-source and works on all major computing platforms. It is downloaded from https://www.arduino.cc/en/Main/Software.
The Arduino controller will initialize and then execute the setup() sequence once. It must be named exactly so. Words which are printed in bold in the Listing ?? cannot be altered and have a specific meaning. Upper and lowercase also matter. Use the curly brackets to define the scope of this function. The second function that must be implemented is called loop(). After the setup, the loop function will be executed and repeated forever as long as the Arduino board has power. In order to slow down the execution of the code, you can use the function delay(), which will do nothing for a given time specified as an integer in units of .
When numbers are stored in variables, they can be stored in either an int or float. Variable names are up to you and are not printed in bold, such as the variable celsius in Listing ??. The difference is that int can only store whole numbers; i.e. integers. The float can store decimals. Therefore, 2.0 is automatically a float and 2 is an integer. The storage of numbers in integers uses less memory.
void setup() {
  pinMode(12, OUTPUT);
}

void loop() {
  digitalWrite(12, HIGH);
  delay(500);
  digitalWrite(12, LOW);

  // wait for 1000 ms
  delay(1000);
}
11.2 Prediction
Turn in the following predictions before starting the experiment.
Calculate the resistor needed for 5 V circuit to provide 1.6 V needed for an LED.
Describe the difference between the setup() and loop() functions in Arduino C.
Predict in the form of a graph, the temperature change of a black and a white can as a function of time, when illuminated with the same intensity of light. Make a second graph for the cooling process.
11.3 Exp I: Hand Motion Controller
The goal of this experiment is to determine the angular resolution of a flex sensor. First, create a circuit and program with the Arduino micro controller that will turn on an LED, if a flex sensor is bent beyond a particular angle. The LED should be off, when the sensor is straight, and on when the sensor is bent. Remember that the LED has a polarity, and also remember that the maximum voltage that can deliver to an LED is 2 V; therefore, you have to limit the voltage that the board outputs.
Devise a method to measure and quantify the angle or bend of the flex sensor. There are many ways to quantify the bending of the sensor. Using a phone to image the sensor’s position may provide important data. Measure the resistance as a function of your newly defined quantity and create a detailed graph. You should measure reversibility and note any hysteretic effects. Secondly, probe any limitations as to the resolution to the bend angle that can be detected, any time effects, hysteretic effects. Finally, compare your results with the results available from the manufacturer. Reflect on developing a wearable glove, where the fingers’ motion is detected using flex sensors.
Optionally, replace the LED with a servo motor or the piezo buzzer and control motor speed or sound frequency using the flex sensor.
11.3.1 Flex Sensor
The flex sensor has only two inputs. It acts as a resistor. The value of the resistance is measured with a ; i.e. a circuit with the the flex sensor is put in series and connected to the 5 V output. Reading the voltage split, it is possible to determine the resistance of the flex sensor.
11.4 Exp II: Radiation
There are several low-cost temperature sensors for the Arduino micro-controller. The simple TMP36GZ has three pins. The pins correspond to ground (\(V_{gnd}\)), the measured output voltage (\(V_{out}\)), and the source voltage (\(V_s\)). It is important to identify the proper grounding pinThe operating source voltage can be . The output voltage is proportional to the temperature in units of .
If the leads to the temperature sensor are long, then you should use a capacitor of approximate size 0.1 . Note that the time constant for A capacitor that is connected between the \(V_s\) and the ground will smooth the supply of the voltage. You can also add the capacitor between the ground and \(V_{out}\) to smooth the output signal; it will average the signal better.
All sensors have several characteristics, which are quite different, from the theoretical - or maybe expected - behavior. The data sheet for the TMP35/TMP36/TMP37 sensors lists some of these characteristics. You should be mindful, especially when interpreting the results.
11.4.1 Digital to Analog
An essential component of the Arduino board is the digital-to-analog converter (DAC). In this case it is a 10-bit converter, which means that digitally, it can distinguish \(2^{10}\) or 1024 states. If the analog input voltage is referenced at 5 V, it means that the maximum resolution is roughly 5 mV. On the other hand, a 16-bit DAC board would have a resolution of roughly 80 , or about 4 significant digits maximally.
Software can easily handle digital information, so sensor’s analog output is generally converted into a digital signal, which will be read with the function analogRead(), see Listing ??. Arduino’s DAC outputs a value between 0 and 1023, which must be converted to a voltage. If the reference signal is 5 V, then it is converted with a factor 5/1024.
// read out TMP36GZ temperature sensor on analog pin 0
float readTMP36GZ()
{
  float celsius;
  int sensorValue = analogRead(A0);
  // convert DAC to voltage, assuming 5V input
  float sensorFloat = sensorValue*5.0/1024.0;
  //  Serial.println(sensorFloat, 2);

  // take the average value of 10 readings
  for (int i=2; i <=10; i++) {
    sensorValue = analogRead(A0);
    sensorFloat += sensorValue*5.0/1024.0;
  }
  sensorFloat /= 10.0;

  celsius = (sensorFloat - 0.5) * 100.0;
  return celsius;
}
11.4.2 Thermal Characteristics
The temperature sensor will produce heat through common resistive heating, also known as Joule heating. For Joule heating, the heat power generated is \(P = I^2 R\), so proportional to the square of the current. Therefore, the sensor (die) will be slightly hotter than the sample (socket) that it is mounted to. In still air - without a fan - this effect is small, or about 0.04 °C at room temperature with a 5 V energy supply. This is smaller than the sensitivity of the sensor.
The transient time, or time to reach equilibrium, is set by the thermal capacities of the sensor (die plus case) and the sample, as well as air surrounding it. In still air, typical relaxation times can be tens of seconds, while in stirred oil, the times can be reduced to a few seconds.
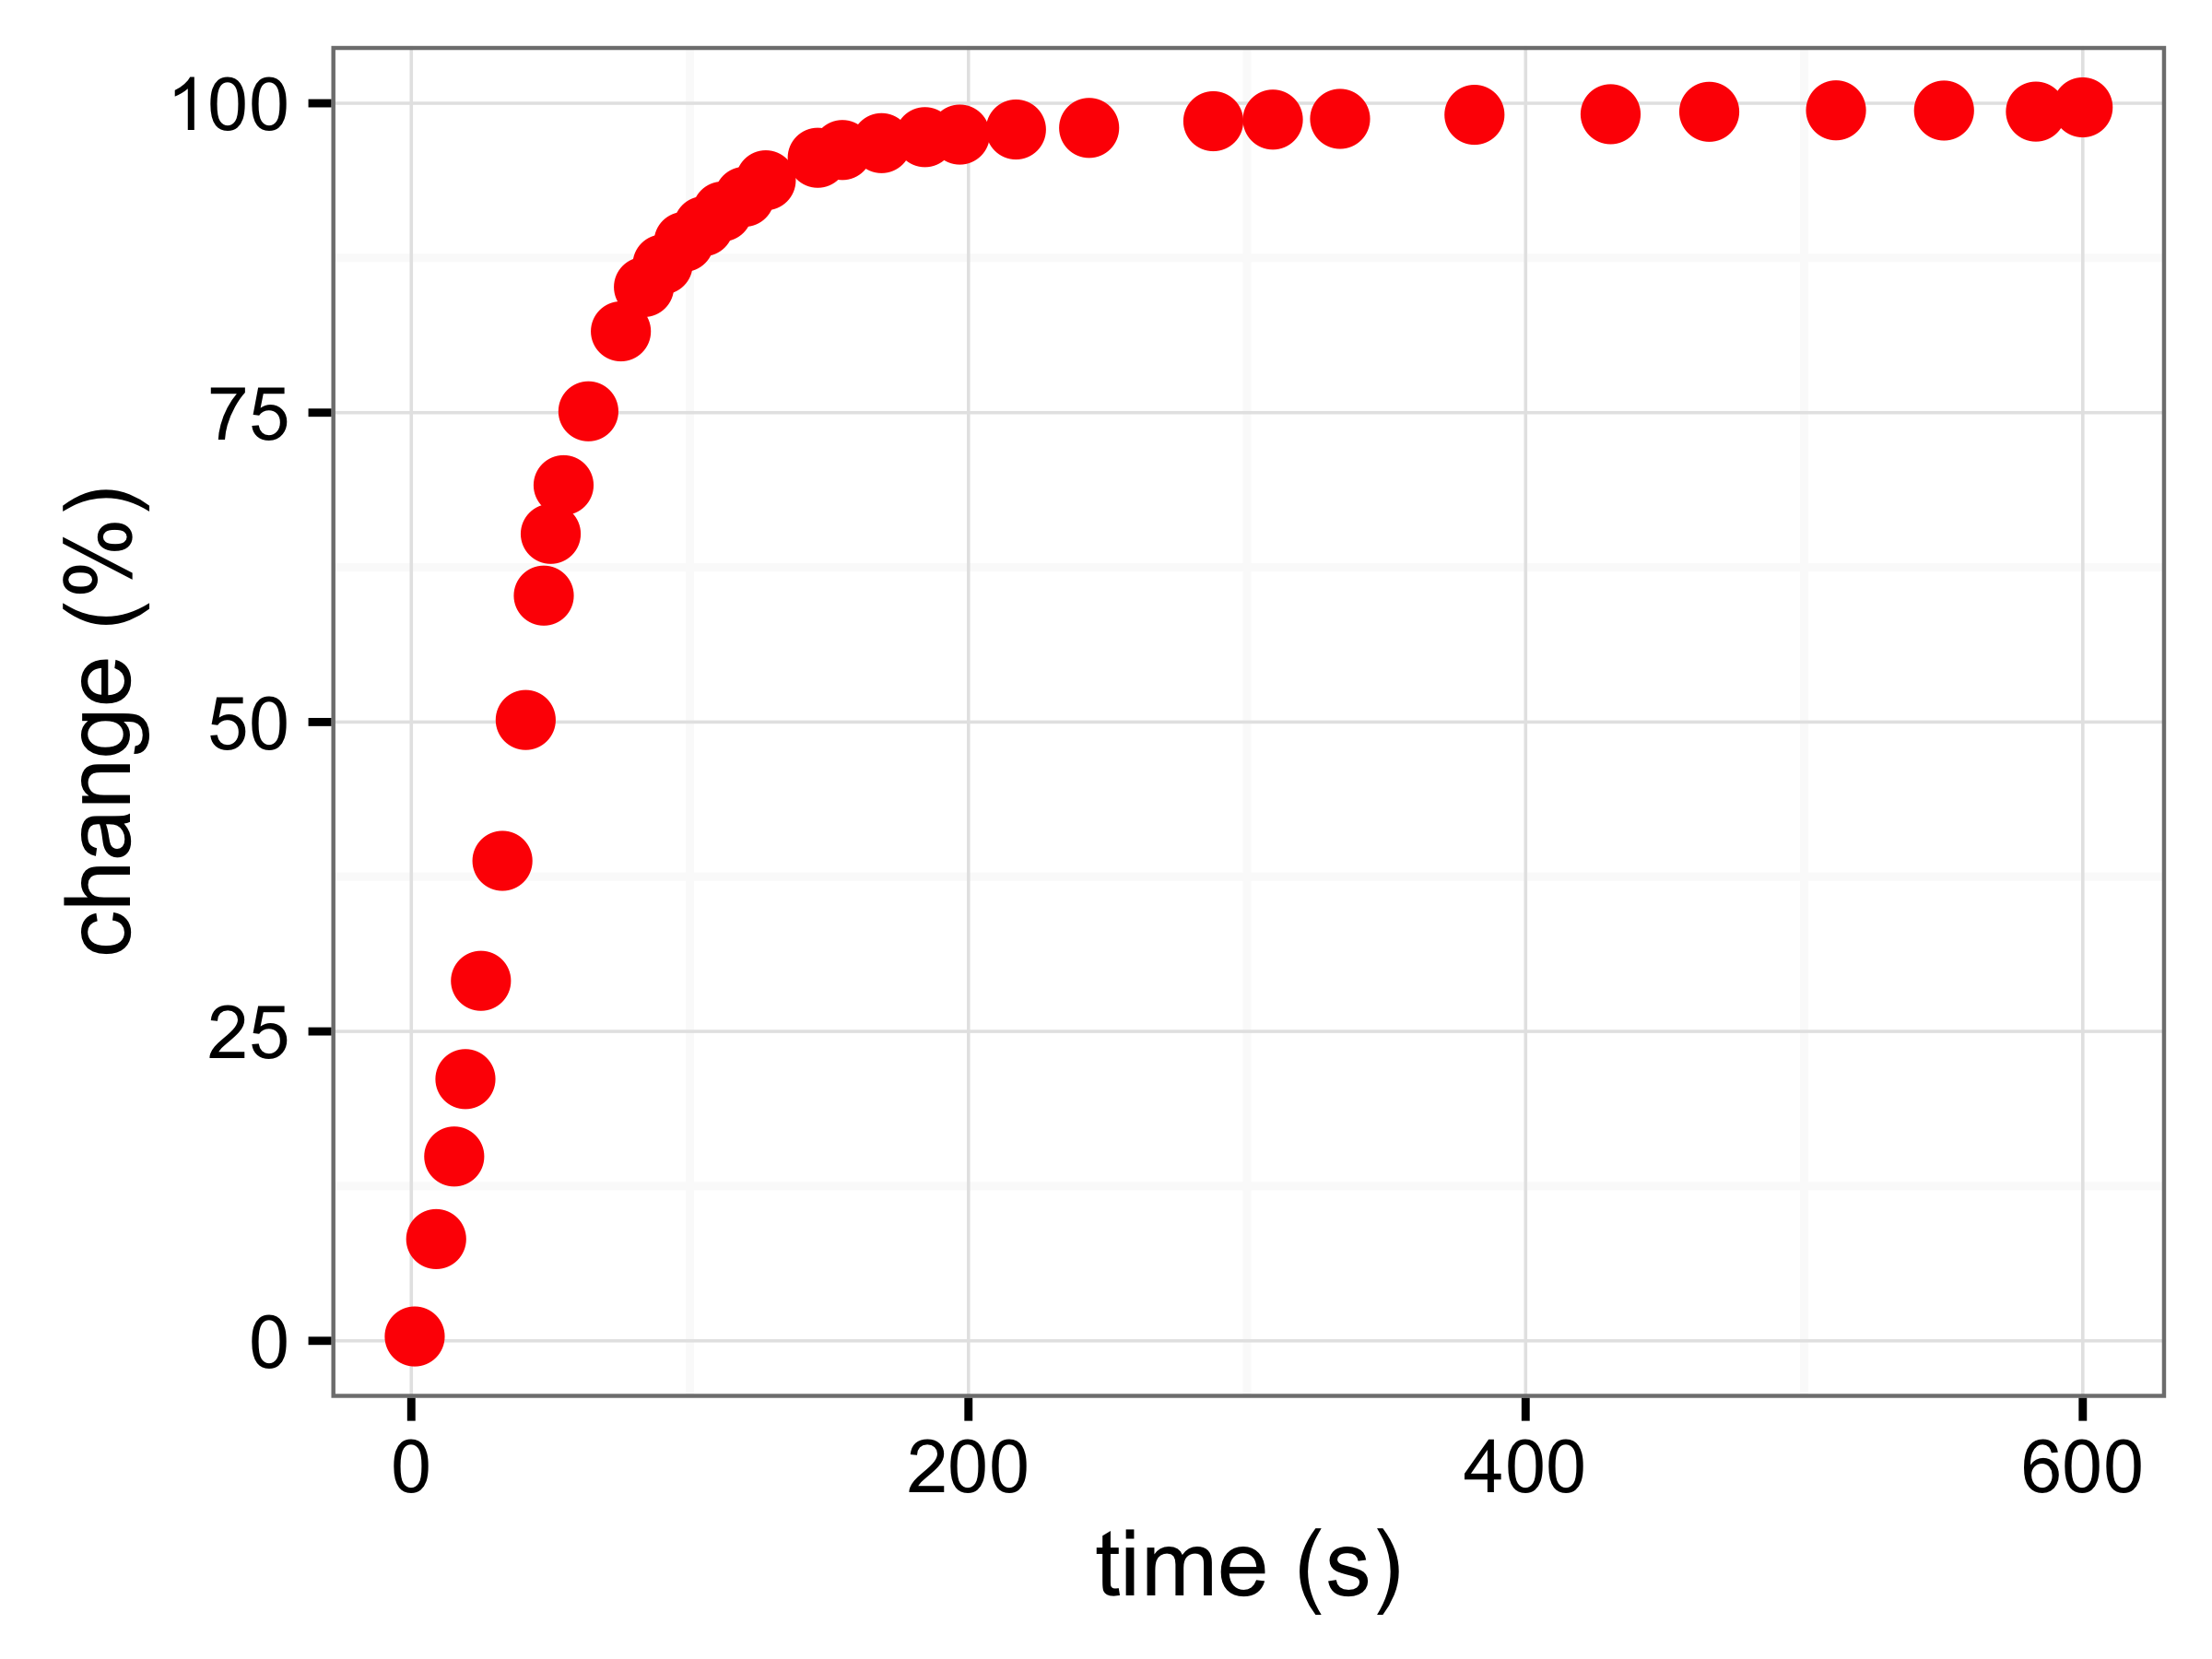
Thermal response time for TMP35 SOIC soldered to 0.5" \(\times\) 0.3" Cu PCB in still air adopted from the data sheet for TMP35/TMP36/TMP37.
11.4.3 Black Body Radiation
In this experiment, we will examine some principles from the black body radiation. In particular, we will compare aluminum cases of equal mass, but different color and their performance in heating up, as well as giving heat off.
In the first part, we prepare the Arduino board with two temperature sensors that can be read at the same time. One sensor is connected to the darker object, and the other to the lighter object. We will then use a lamp of known power output, measure the distance and compute the incident energy onto the object. Make sure to start the experiment in equilibrium at room temperature, then turn on the light and wait for the new equilibrium temperature. Later analyze the power, and the relaxation time for reaching the higher temperature.
In the second part, start the two objects at the same temperature and let them cool down. Again, monitor carefully the temperature as a function of time as the objects are cooling. Try to also predict which body will cool faster, the darker or lighter body.
11.4.4 Exporting Data in Arduino
If the Arduino board has a WiFi shield attached, then you can send the measurement data directly to a computer that will capture. The basic Arduino, however, communicates via the serial port. The serial port needs to be enabled first with the Serial.begin command, see Listing ??. You can then use the Serial.print to output a number and communicate via USB back to the computer. When you monitor the serial output, you can monitor the signal. Use the copy command and paste the information into a spreadsheet that you can read and analyze within Excel or R.
void setup() {
    // opens serial port, sets data rate to 9600 bps
    Serial.begin(9600);

    // print header
    Serial.println("time (s), pin 0 (V)");
}

void loop() {
  // read the analog input on pin 0:
  float analogVolt = analogRead(0)*5.0/1024;

  // print it out in many formats:
  Serial.print(analogVolt);       // print as an ASCII-encoded decimal
  Serial.print(",");
  Serial.println(analogValue);       // print as an ASCII-encoded decimal

  // delay 100 milliseconds before the next reading:
  delay(100);
}
11.5 Exp III: Bot
The bot project is really about engineering a robotics device. It also has a challenge, a course will be given that the bot has to navigate. The course is outlined with white tape on a black table surface. The bot has to follow the course and then park in front of a large wood block. Therefore, you should equip your bot with the necessary sensors and program it to complete the task safely.
In addition to the line follow sensor that operates with infrared and detects a change in the contrast on the table, you should also use low-cost ultrasonic distance sensors. Other sensors may also be incorporated. Additionally, you could have LEDs show you feed-back.
The sample program in Listing ?? loads functions from the RedBot library. You can install the library, by selecting Sketch \(\rightarrow\) Include Library \(\rightarrow\) Manage Library and search for the SparkFun RedBot Library. Once the library is installed you can use functions such as motors.drive(), which will turn on the motors.
#include <RedBot.h>  // loads RedBot library
// Provides special objects, methods, and functions for the RedBot.

RedBotMotors motors; // Initiate motor controls

void setup()
{
  motors.drive(127);   // Turn on Left and right motors at half speed.
                // Max speed is 255
  delay(1000);          // Waits for 1 seconds
  motors.stop();        // Stops both motors
}

void loop()
{
  // Nothing here. We'll get to this in the next experiment.
}
11.6 Arduino Lab Report
The lab report includes the results from the first two experiments. This includes a graph of the resistance versus the flex sensors position. In the analysis, you discuss the limitations of the sensor and make a comparison with the available data from the sensor. In the second part, include the results of temperature versus time for heating and cooling two differently colored objects. Discuss the results with your understanding of black body radiation. Discuss the implications of the results on how to color buildings, cars, and so on.