Fourier Methods
Background Concepts
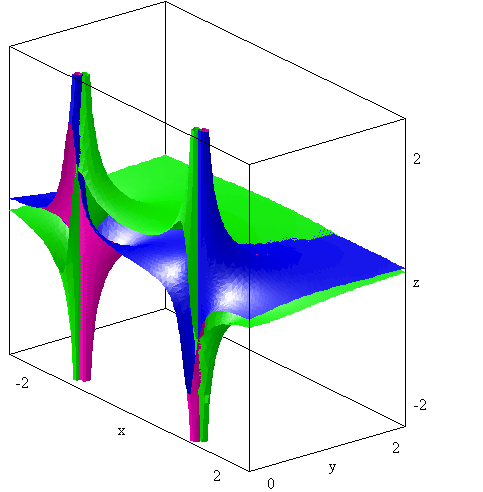
The transfer function is a complex function of frequency, shown here as a pair of curves on the front of the box (x,z plane).

The real part of the function is the intersection of the green surface with the x,z plane, and the imaginary part is the curve where the purple-red surface hits the front.
This figure shows how the transfer function is related to a complex function of a complex frequency, for which y is the imaginary part. There are two singularities called "poles" in this picture. In a kinetic display, you can make the poles move along a semicircle in the x,y plane by varying the damped frequency (wd). One can notice how the two curves on the front surface change by doing this. Some very interesting and useful mathematics is represented in this figure.
In order to view this kinetic image, you must have a program called " DP Graph Viewer" (900kb).
-- Click Installation Guide to down load DP Graph Viewer.
-- To learn how to rotate, zoom in/out, and change parameters of the graph click on this
guide: Fourier Methods Guide.
If you have installed the DP Graph Viewer, then click on "Damped Oscillator Transfer Function" below to see the kinetic display in action. (Underneath each link is an option to see the static image.)
� Real and Imaginary Parts of the Damped Oscillator Transfer Function
(Click here for static image --> Real and Imaginary Part of the Damped Oscillator Transfer Function)
A complex function can also be represented in terms of its absolute value and phase angle. See the following kinetic image.
� Amplitude and Phase of the Damped Oscillator Transfer Function
(Click here for static image --> Amplitude and Phase of the Damped Oscillator Transfer Function)
A single pole shows simpler behavior than the full transfer function. See the following kinetic displays.
� Real and Imaginary Parts of -iz -1
(Click here for static image --> Real and Imaginary Parts of -iz-1)
� Amplitude and Phase of -iz -1
(Click here for static image --> Amplitude and Phase of -iz-1)
![]()