GEOG 442
Biogeography
Lab: Climographs and Climate Classification

This lab will have you create a climograph for a particular place on Earth and then use those data to classify the site into one of the Köppen-Geiger climate types and to predict the general type of vegetation found in the region. Each person will work alone on two (or in some cases only one) climograph. Those who work on the sites highlighted below only do the one site because it involves a bit more difficulty than the others, so I'm trying to even out the workload.
Getting Your Data
First, get your data entry form: https://home.csulb.edu/~rodrigue/geog442/labs/climograph.pdfSecond, arm yourself with a description of the Köppen-Geiger climate classification, so you can assign one of the following codes to your assigned climate station: Af, Aw, Am; BWh, BWk, BSh, BSk; Csa, Csb, Cfa, Cfb, Cwa, Cwb; Dfa, Dfb, Dfc, Dwa, Dwb; ET, EF. Brittanica has a concise review at: https://www.britannica.com/science/Koppen-climate- classification.
Then, go to http://www.worldclimate.com. There, do a search on your assigned site. What you're looking for is "24-hr. Average Temperature" and "Average Rainfall." For some of these, you may find two seemingly identical copies of one or the other; in that case, pick the upper of the two (it's usually the one with the most records and, so, is more stable).
- Jakarta, then select Jakarta/Observatory, Indonesia -- Mr. Amendariz
- Los Angeles, then select Los Angeles Civic Center, then select Canoga Park, Pierce College -- Mr. Amendariz
- Pyongyang, then Pyongyang, North Korea -- Mr. Ibarra
- Atlanta, then Atlanta/Mun, GA -- Mr. Galsim
- Fallon, then Fallon St., Churchill County, NV
-- Ms. Honey - McMurdo Station, then McMurdo Antarctic Stations -- Mr. Stangle
- Chicago, then Chicago OHare Intl Arpt -- Ms. Mouren-Laurens
- Kunming, then Kunming, China -- Mr. Wellsfry
- Montréal, then Montréal, Canada -- Mr. Sandoval
- Tombouctou, then Tombouctou, Mali
-- Ms. Bakos - Mayagüez, PR, then Mayagüez City, Mayagüez, Puerto Rico USA -- Mr. Mayer
- Bangkok, then Bangkok, Thailand -- Mr. Galsim
- Los Angeles, then Los Angeles Intl Arpt -- Mr. Ibarra
- Irkutsk, then Irkutsk, former Union of Soviet Socialist Republics --
Mr. Sandoval
- Jaipur, then Jaipur, India
-- Dr. Rodrigue - Stanley, then Stanley, UK, then Stanley UK, WMO Region 3,
Falkland/Malvinas Islands, southeast of South America -- Mr. Stangle
- Roswell, then Roswell Indust Aprk, Chaves Co, NM
-- Mr. Maka - Wellington, then Wellington New Zealand -- Mr. Mayer
- Patna, then Patna, India -- Ms. Mouren-Laurens
- Birobidzhan, Jewish Autonomous Oblast, Siberia, Russia: Not in this
database, but I found the data needed to classify it --
(https://home.csulb.edu/~rodrigue/geog442/labs/BirobidzhanClimateData.png -- Mr. Wellsfry
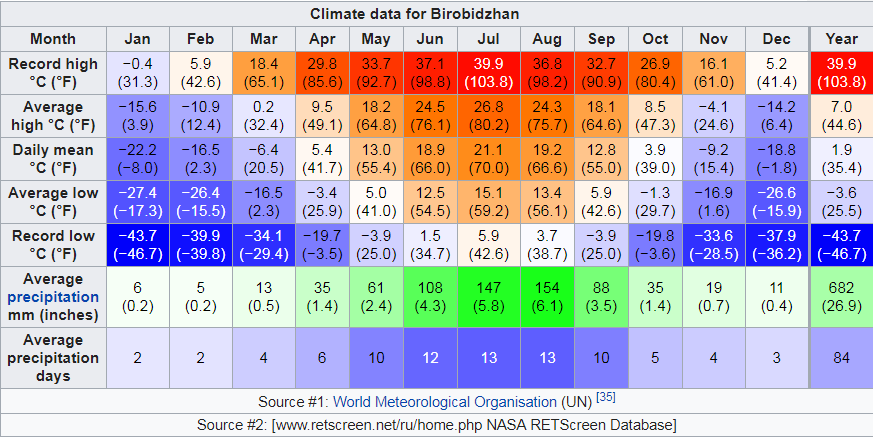
Have no idea where your station is? Fire up Google Earth or Google Maps or your favorite browser mapping program and simply do a search.
Analyzing and Visualizing Your Data
Construct a climograph for your station(s)' data, using dots and a connecting red line for the march of average daily temperatures each month (align with temperature values on the left axis) and, below, a series of bars (blue? grey?) at the height aligned with the right axis to represent each month's precipitation in millimeters.Now, make your decision about which code your station probably is.
Confirm your decision by checking the general location on a global-scale Köppen-Geiger map:
-
http://koeppen-geiger.vu-
wien.ac.at/pdf/kottek_et_al_2006_A4.pdf
or - http://hanschen.org/koppen/img/koppen_all_1901-2010.png
You can use this map to identify three other places that have a climate with the same classification, perhaps another city or just a general description of an area (e.g., "most of Cuba" or "northeastern China near North Korean border" or "most of Botswana").
Lastly, crudely estimate the likely major natural vegetation association in
the area by putting a mark on the following graph at the intersection of your
station's average annual temperature and its total annual precipitation.
Divide your total precipitation in millimeters by ten to convert it into
centimeters, which is what this graph uses:
https://home.csulb.edu/~rodrigue/geog442/labs/climatesbiomes.png
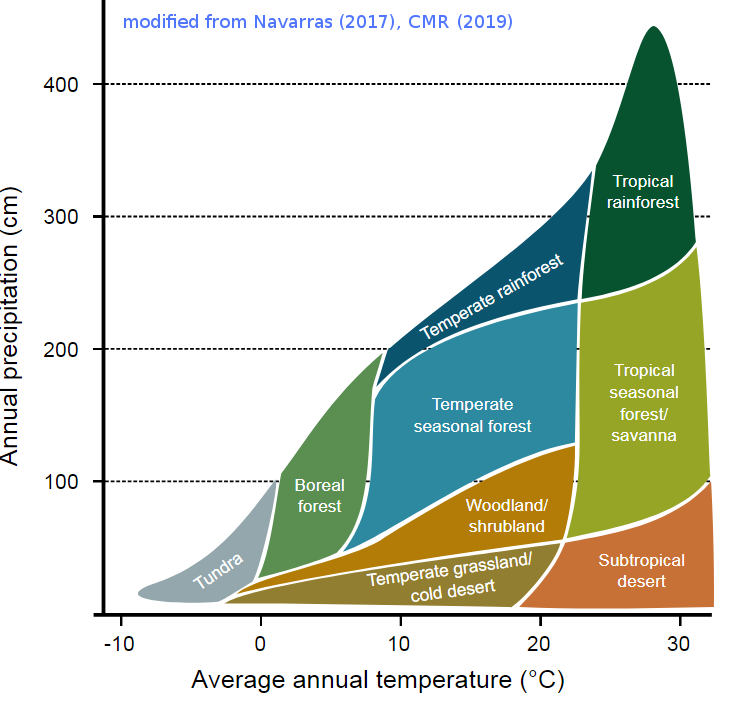
Deliverables:
Turn in:- your climograph(s) and
- the marked climate and biomes graph
GEOG 442 Home | Dr. Rodrigue's Home | Geography Home | ES&P Home |
CSULB Home | Campus Search | Library |
Document maintained by Dr.
Rodrigue
Last revision: 02/03/19