Geography 200: RESEARCH METHODS FOR GEOGRAPHERS
Dr. Rodrigue
Graded Lab 4: ELEMENTS OF SAMPLING AND SPATIAL SAMPLING

EXERCISE A: Review of Accomplishments So Far
As a beleaguered parent, you are beginning to come to terms with your offspring's increasing gerbil collection, especially since it's you who frequently winds up cleaning those cages. Contemplate the following fragrant data set (gerbils per cage):
- A=10, B=15, C=13, D=16, E=12, F=13, G=13
- For the following data set of gerbils per cage, calculate (to two
decimal places) the:
     a) Mean ________   b) Median ________   c) Mode ________

     d) Standard deviation        ________

     e) Co-efficient of variation ________

     f) Skewness (Pearson's)      ________

     g) Skewness (3rd moment)     ________   (bizarre, eh?)
Meditate on the following map of the gerbil cages within your offspring's bedroom: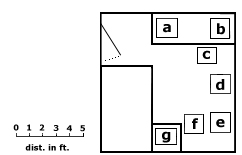
- Using the orientation of the grid provided,
- (a) calculate and mark the weighted mean center of the gerbil
population with a red dot and
- (b) show the Manhattan median of the seven gerbil cages on the map in a contrasting color.
Make sure to indicate which is which (a small legend somewhere).
- (a) calculate and mark the weighted mean center of the gerbil
population with a red dot and
- As a geographer living in Illinois, you've become rather personally
interested in tornado occurrence. You've divided your general region into 9
quadrats 200 kilometers square. In each of these quadrats, you have
determined that there is a 25 percent chance that a tornado will touch ground
in the course of a year. What is the probability, to two
decimal places that 3 of the 9 quadrats will get hit with a tornado this year?
________- On average, the police in a certain Midwestern college town are called to break up 3.1 noisy college parties somewhere in their jurisdiction during the school year.
- (a) What is the chance, expressed as a percentage to two decimal places of accuracy, that they will have a totally peaceful party weekend (i.e., no kegger complaints at all)?
________- (b) What is the chance,expressed as a percentage to two decimal places of accuracy, that there will be fewer complaints than average this weekend (less than or equal to 3 party pooping calls)?
________- A biogeography product of the Beach State program, you have been employed as an ecologist in the U.S. Forest Service assigned to the San Bernardino National Forest. Among your excessive responsibilities, you have to monitor the feral burros in the Big Bear Lake area. You've come to know the local herds and even some individuals. In one particular herd of 15 jennies and 1 venerable jack, on average, 6 of the jennies foal, but there is some variability in this. The standard deviation is 3.1 foals over the twenty years that you and your predecessors have been monitoring this herd. Calculate the probabilities, to two decimal places of accuracy, that:
- (a) at least 80 percent of the jennies will foal this year
________- (b) that fewer than 9 of them will deliver
________ - On average, the police in a certain Midwestern college town are called to break up 3.1 noisy college parties somewhere in their jurisdiction during the school year.
EXERCISE B: Elements of Sampling and Spatial Sampling
For the next questions, read the appendices mentioned.
- Contemplate the methodology statement in Appendix
A of this exercise. What sort of sampling procedure was employed and why
do you think the author chose this approach?
____________________________________________________________ ____________________________________________________________ ____________________________________________________________ ____________________________________________________________- Continue your contemplation with Appendix B and do the same:
____________________________________________________________ ____________________________________________________________ ____________________________________________________________ ____________________________________________________________- As long as you're in a meditative mood <G>, do the same with Appendix C:
____________________________________________________________ ____________________________________________________________ ____________________________________________________________ ____________________________________________________________- And Appendix D, while you're at it:
     ____________________________________________________________

     ____________________________________________________________

     ____________________________________________________________

     ____________________________________________________________
The next questions get you up to speed on random number tables:- Design a routine you will use to pick numbers out of the table found here, and describe it. Pick a starting point as randomly as you can and a rule for moving through the table, which incorporates randomness in selecting directions and what you do at the end of a column or row. Then, list the first 10 numbers, which conform to the following standard: They must be two digit numbers.
____________________________________________________________ ____________________________________________________________ ____________________________________________________________ ____________________________________________________________- Repeat the process, but this time select 10 numbers which conform to the following: three digit numbers with values from 200 through 799.
____________________________________________________________ ____________________________________________________________ ____________________________________________________________ ____________________________________________________________- Ditto once more, but this time select the first 10 numbers that are odd numbers one digit long.
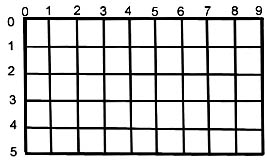
     ____________________________________________________________

     ____________________________________________________________

     ____________________________________________________________

     ____________________________________________________________
The following questions deal with the basics of spatial sampling:- Select 10 points on the following grid, using a simple random point sample method. The points must have whole number X and Y coördinates, which means that the points you mark will be at the intersections of lines. How'd you do it?
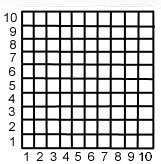
____________________________________________________________ ____________________________________________________________ ____________________________________________________________ ____________________________________________________________- On the following grid of 100 quadrats, each 10 m on a side, select 10 using a simple random sampling method. Fill in the quadrats corresponding to the row and column coördinates you take from the random number table. Briefly describe that method (how you got into the table and moved through it).
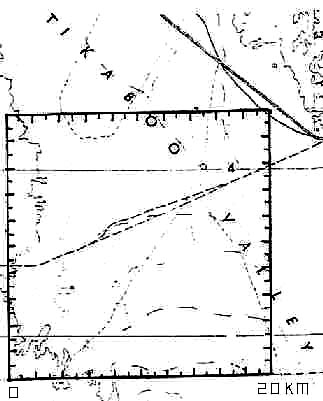
____________________________________________________________ ____________________________________________________________ ____________________________________________________________ ____________________________________________________________- There you are, a lone biogeographer out in the middle of the Tikaboo Valley of Nevada (nowhere is a local call), wondering what ever got you interested in desert vegetation. You have come here to set up 5 km-long transects along which you plan to pick points, identify the nearest big sagebrush plant (Artemisia tridentata) within 5 m of those points and, if there's one present, its nearest neighbor greater than 25 cm in height. So, pick an initial starting point for your first transect, using a simple random point sample method based on use of the random number table. Now, pick an orientation for your first transect, using 360 degrees of a circle (0° and 360° being true north) and your random number table. Draw a line with that orientation starting from the selected starting point on the map below, unless the 5 km-long line would fall out of your study area boundaries. In that event, go back to the table and pick another compass orientation. Now, repeat the process of random point choice and random orientation choice two more times. You should wind up with three lines scattered on the map, which have different orientations (with no pattern or alignment among them).
APPENDICES
In order to accomplish the purpose of this thesis, a source of data must be employed, which is consistent with Roseman's theory and, therefore, is appropriate to the testing of the variables chosen to evaluate it. In addition, a methodology fitted to the purpose and to the logic behind it must be specified. The following discussions are devoted to these ends.
Data
Roseman's ideas are rather difficult to implement. Since his theory generalizes from the behavior of individual migrant households to aggregate-level phenomena, any evaluation of that theory's validity should ideally make use of household-level data. The aqcuisition of such data is costly in terms of time and effort, as they must be obtained from the migrants: traditional data sources, such as the Census, are simply not available in the form that is the most appropriate to the testing of the Roseman framework. In order to obtain such household-level data, individual households belonging to the defined population of migrants must be identified.
In order to identify those households, the names and addresses of all parties purchasing properties in Northridge were obtained from the Los Angeles County Tax Assessor's Office. To distinguish migrant households from those parties purchasing homes, commercial properties, or residential properties for investment purposes, all names of companies and corporations were excluded as were family trusts buying multiple properties or those whose mailing addresses were different from the in situ addresses. After removing these elements, the remaining 1625 names were assumed to be those of migrant households.
To provide an adequate sample, a list of all Near Eastern sites mentioned in some twenty secondary works on archaeology in the area was assembled .... Presumably, a list assembled from secondary sources is composed of relatively well published sites. A workable sample of sites was drawn in a statistically unbiased way for more detailed data collection.
The list contains the alphabetized names of 526 Upper Palaeolithic through Neolithic/Chalcolithic sites in the Near East, ranging from 20,000 through 5,000 BP. Together with their names, locations and general technological level(s) have been coded. Forty-two sites were identified as Upper Palaeolithic in technological level, 87 as Epi-Palaeolithic, 63 as Mesolithic, and 408 and Neolithic. Neolithic takes in aceramic and ceramic Neolithic and Chalcolithic sites. These were not distinguished, because it proved impossible to identify the specific Neolithic level a priori. The four numbers add up to 600, rather than 526, because each major technological level within a site was counted as a separate occupation or settlement. Some sites were counted more than once, because they were occupied continuously or were reoccupied after a major change in technological level.
Once the sites were categorized as Upper Palaeolithic, Epi-Palaeolithic, Mesolithic, or Neolithic, a random sample of 60 was drawn. The sample is ten percent of the population of 600. The sample was stratified by general technological level, which corresponds roughly to the changing human relationship with nature that shapes the development of animal husbandry motives. Seven percent of the population and sample were Upper Palaeolithic in character. Fifteen percent were Epi-Palaeolithic; ten percent were Mesolithic; and 68 percent were Neolithic. The sample was drawn from a random number table, such that the proportion of each level in the sample duplicated that in the population. Proportionally stratified random sampling was used in order to employ the non-parametric statistical techniques appropriate to nominal data.
At the first stage in sample development, 100 counties are selected. Probabilities of selection are proportionate to population. All US counties and the District of Columbia are first classified by region (the 9 Census Geographic Divisions) and then as metropolitan or non-metropolitan, to yield 18 strata. Then, all counties within the 18 strata are ranked by population size. The counties used as primary sampling units are chosen such that all 9 Census Geographic Divisions have both metropolitan and non-metropolitan representatives.
In the second stage, two Census block groups or equivalent units are selected, again with probabilities of selection proportionate to population. At the third stage, two sample locations (Census blocks or rural equivalents) are chosen. Again, the likelihood of a given block being chosen is proportional to its population.
At the block level, interviewers are deployed to conduct visits at all residences in the block. Half the blocks are first visited after 5 p.m. on weekdays or on the weekends; half are first visited before 5 p.m. on weekdays.
last revised: 02/27/17
© Dr. Christine M.
Rodrigue