Geography 200: INTRODUCTION TO RESEARCH METHODS FOR GEOGRAPHERS
Dr. Rodrigue
Graded Lab 3: SPATIAL MEASURES OF CENTRALITY AND DISPERSION
INTRODUCTION TO PROBABILITY

EXERCISE A: Mean Center, Standard Distance, Manhattan Median, and Euclidean Median
After absorbing Ch. 3-4 in M & M, calculate the x-y coöordinates of the mean center of the points mapped on Figure 1. Mark the mean center on the map in a contrasting color or point design. Brownie points if you do the calculations on your spreadsheet. Please show your answers rounded to the nearest TWO decimal places (e.g., 0.00).
- Mean x coördinate: _______________
- Mean y coördinate: _______________
- Calculate the standard distance for this point pattern. Also,
Draw a
circle on the map with that radius around the mean center.
Sd = ______________________________- What can be found in that circle, at least theoretically in a large sample or population? Is that the case, approximately, with this data set?
_________________________________________________________________ _________________________________________________________________- Calculate the relative distance for this distribution. Helpful hints follow: You need to figure out area Ain square meters from the map. Once you have that area, you need to create a circle that contains the same area as your square map. Once you know the dimensions of such a circle, can use its radius, r as the denominator of the formula for figuring out standard distance. Here is the reasoning behind calculating that all-important radius. You know the area (A) and you know
![[ pi ]](https://home.csulb.edu/~rodrigue/geog200/pi.gif) By the way, or "pi" is roughly
3.14159. What you don't know is the radius. Here is the formula for
calculating the area of a circle. Re-arrange it, so that r2 is by
itself on one side of the formula. Solve for r2, and then take its
square root, and voilà, you have the radius you need.
By the way, or "pi" is roughly
3.14159. What you don't know is the radius. Here is the formula for
calculating the area of a circle. Re-arrange it, so that r2 is by
itself on one side of the formula. Solve for r2, and then take its
square root, and voilà, you have the radius you need.
     A =  r2

     r2 = A/
           _____
     r = \/ A/

                                   r = ______________________________
You are creating a measure of spatial dispersion that is standardized into a 0-1 format, so that you can compare one distribution against another in the same units, no matter what kinds of units (inches, feet, centimeters, meters, miles, kilometers) were originally used to measure the distance between points. You are, basically, comparing the standard distance against another distance (a radius, a radius related to the size of the study area). This is kind of what the coëfficient of variation does for the regular old standard deviation.
So, now that that little chore has been taken care of, what, then, IS the relative distance?
Rd = Sd/r Rd = ______________________________- Calculate and mark the Manhattan median on the map for the 30 points in this study area.
- Discuss in your own words the difference between the general concepts of Euclidean distance and Manhattan distance (not Euclidian median and Manhattan median). Which one is pretty consistently a larger value than the other? Under which circumstance would the Euclidean and the Manhattan distances be equal?
     _________________________________________________________________________

     _________________________________________________________________________

     _________________________________________________________________________

     _________________________________________________________________________
EXERCISE B: Manhattan and Euclidian Medians
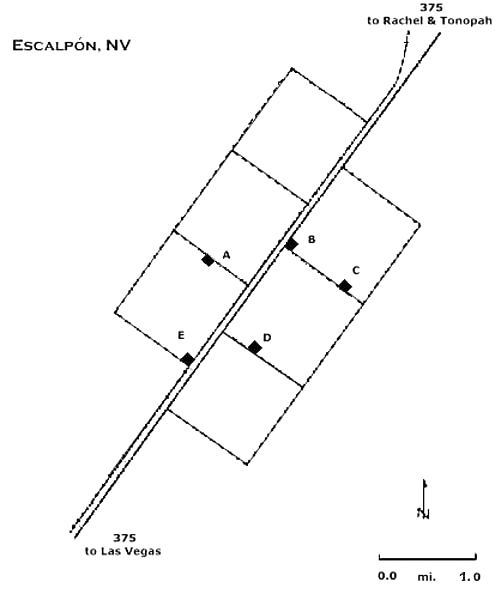
Your client, B & B, Inc., has identified Escalpón, Nevada, as a community in which it wishes to open a gag and humor shop. Ecalpón is the kind of smaller community B & B has targeted for its spatial strategy. The town is a socially relatively homogeneous middle class community of about 48,000 souls, with six census tracts to its name. Each of the six tracts has roughly 7750 to 8250 people, so it's not really worth bothering to weight the tracts. Because the town is an old railroad town, its streets are strongly gridded: the census tracts, suspiciously enough, happen to be square and 1 mi. on a side. Lucky you.
- Mark the exact center of each of the six census tracts with a
point.
- Calculate the Manhattan median for the distribution of the six center
points in Figure 2.
Use the orientation of the town's grid (i.e., NE/SW, NW/SE). Mark that
median
as a rectangle aligned with the railroad and street/tract grid, directly on
the map.
- B & B has identified five available store locations that meet their
site requirements. These are also mapped on Figure 2. Estimate the store
that is closest to the Euclidean
median, i.e., the location that minimizes travel distances for customers
coming from the six tracts to the final store chosen. Here is the
definitional (not computational!) formula for the Euclidian median
(don't try this equation at home alone, kiddies!):
![[ mathematical definition of the Euclidean median ]](https://home.csulb.edu/~rodrigue/geog200/200EuclideanMedian.jpg)
Where i represents the (X or Y) coördinate of the center of each Census tract and e represents the (X or Y) coördinate of the eternally sought-after but ever unattainable Euclidean median.
Out of incredible kindness, I will have you truncate your calculations to just the five locations your client is proposing. You will need to go iteratively through the process of calculating Euclidean (bird's flight) distances from the center of each store to the center of each tract (rather than going through the process to the true Euclidean median, you will identify which of the five proposed sites is closest to the probable Euclidean median).
Remember, you won't get the Euclidean median: You are only going to follow the iterative process for just as many locations as are available to the company (5, i.e., locations A-E) in order to figure out which one is closest to the unknown Euclidian median.
If you find the prospect of measuring 30 distances (6 tract centers times 5 stores) a bit tedious, you could use basic geometry and a spreadsheet to make your life a little easier. Create a grid over the map that has perhaps a quarter mile resolution. Figure the X coördinates in miles for each of the 6 centers and 5 stores and the Y coördinates for each. Then, note the X and Y distance between each store and each center and put it in your spreadsheet. Remember the Pythagorean formula for figuring out the hypotenuse? A2 B2 = C2?
However you work it out, you are figuring the total or aggregate distance (Dj) for each of the five stores, A-E, to all six Census tract centers:
![[ mathematical definition of the total aggregated distance ]](https://home.csulb.edu/~rodrigue/geog200/200TotalAggrDist.jpg)
Fill out the table below showing the aggregate, total distance for each proposed store to the six Census tract centers. Now, put a check on the table next to the one that is likely to be closest to the true Euclidian median. Mark and label it on the map as your recommended site.
     A:  _______________          D:  _______________

     B:  _______________          E:  _______________

     C:  _______________
EXERCISE C: Introduction to Probability (M & M Ch. 5)
- In your own words, differentiate deterministic from probabilistic processes:
- In your own words, differentiate discrete from continuous probability distributions:
- In your own words, define the terms, "event" and "outcome":
- In your own words, relate the concepts of "event" and "outcome" to those of "event space" and "sample space."
- Now, draw a Venn diagram, outlining in black the sample
space for tossing a single die. On that diagram, use a red line to enclose the event space for those tosses
that would turn up a prime number on the face of the die (make sure you
know what a
prime number is -- you might check with Eric Weisstein's Mathworld encyclopædia). Use a
blue line to enclose the event space for
those tosses turning up even numbers.
Use a green line to mark the event space
that represents the intersection of the two previous event spaces.
- Draw an outcome tree to show the probabilities of getting the
following
results from an I-Ching toss of three coins: HHH, HHT, HTH, THH, TTH, THT,
HTT, TTT:
- What is the probability of getting three tosses in a row that have the same side up?
- Which probability distribution is designed for such problems?
- What is the probability of getting exactly four heads in the course of eleven flips of an honest coin?
- Let's say you have a dishonest coin, such that its probability of landing tail side up is 0.6. Now what would be the probability of getting exactly four heads in the course of eleven flips? Your answer may surprise you....
- Which probability distribution is appropriate for calculating the probability of getting a count of certain events within a given time period or within a given area?
- On average, 2.5 camping groups turn up each day in the Cucamonga Wilderness Area each summer. Calculate the probability of getting no groups at all on a particular day next summer.
- Calculate the probability that the rangers will have to deal with anywhere from 1 through 3 parties of happy campers?
- Looking at the array of probabilities you calculated for X = 0, 1, 2, and 3, which is the modal number of camping groups likely to descend on the area on any given summer day?
- Which probability distribution is appropriate for modelling the frequency of occurrence for a continuous variable, in which the distribution of cases is symmetrical and mesokurtic?
- Calculate the mean and the median for each of the following two sample data sets, to two decimal places of accuracy. Just using these two data descriptors, which of the two is likelier to have come from a normally distributed population?
- Compute the standard deviations for each of these two data sets.
- Now, convert each distribution's scores into standard Z scores. Again, show your work to two decimal places of accuracy.
- What is the probability that case 11 sampled from Population A will exceed 20? Show your answer to four decimal places of accuracy (e.g., 0.0000).
- What is the probability that case 12 sampled from Population B will fall between 4.0 and 6.5? Again, show the answer to four decimal places of accuracy.
     _________________________________________________________________________

     _________________________________________________________________________

     _________________________________________________________________________

     _________________________________________________________________________

     _________________________________________________________________________
     _________________________________________________________________________

     _________________________________________________________________________

     _________________________________________________________________________

     _________________________________________________________________________

     _________________________________________________________________________
     _________________________________________________________________________

     _________________________________________________________________________

     _________________________________________________________________________

     _________________________________________________________________________

     _________________________________________________________________________
     _________________________________________________________________________

     _________________________________________________________________________

     _________________________________________________________________________

     _________________________________________________________________________

     _________________________________________________________________________
_______________
_______________
_______________
_______________
_______________
_______________
_______________
_______________
_______________
                  _____ A  _____ B    Why?  __________________________

     _________________________________________________________________


     ----------------------------------------------------
     A.   15.0    mean(A)           B.   1    mean(B)
          21.2                           4
          23.0    _______                5    _______
          19.1                           2
          18.6    median (A)             6    median (B)
          17.3                           2
          20.8    _______                5    _______
          16.7                           2
          18.9                           2
          19.4                           7
                                         3
     ---------------------------------------------------
Sa = _______________ Sb = _______________
          raw       Zi                  raw      Zi
     ----------------------------------------------------
     A.   15.0    _______           B.   1    _______
          21.2    _______                4    _______
          23.0    _______                5    _______
          19.1    _______                2    _______
          18.6    _______                6    _______
          17.3    _______                2    _______
          20.8    _______                5    _______
          16.7    _______                2    _______
          18.9    _______                2    _______
          19.4    _______                7    _______
                                         3    _______

     ---------------------------------------------------
_______________
_______________
first placed on the web: 09/20/98
last revised: 09/19/11
© Dr. Christine M. Rodrigue