Which students have traditionally been drawn to the various geosciences over
the decades? [ VIEWGRAPH 2 ] A
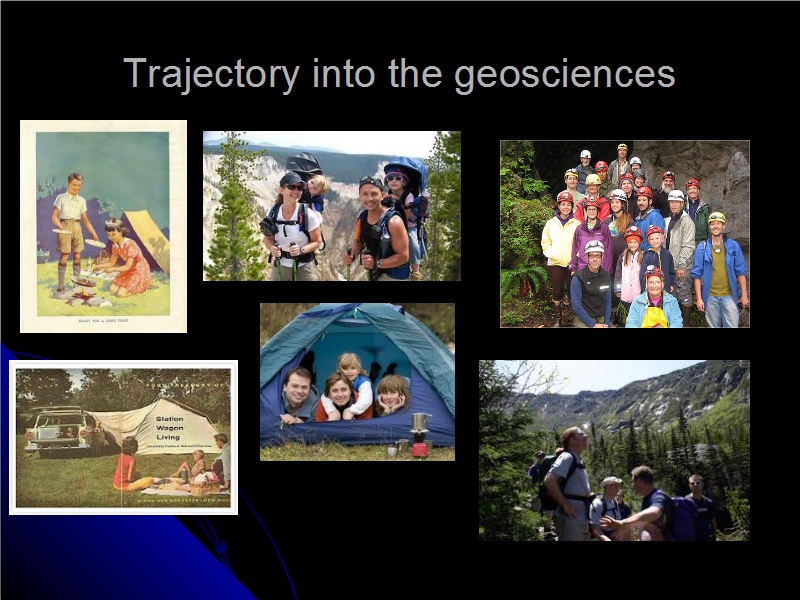
common source of geoscience majors has been the middle-class white family that
was able to take their children camping, hiking, hunting, fishing, scouting,
or otherwise expose them to outdoors activities. These activities might
predispose children to be interested in the earth, and that predisposition may
have then been re-awakened in a college general education course. This
traditional trajectory into the geosciences, while wonderful experiences in
themselves, may no longer work as effectively in a dynamically changing
American population. The geosciences are overwhelmingly white and
disproportionately male, mismatched to the broader American population and the
population of college students coursing through our general education
curriculum. America and American college students are becoming much more
diverse, but the geosciences have not been successful in attracting the new
pools of talent they will need to thrive and ensure needed geoscience
expertise in confronting contemporary environmental problems.
National demographic data are unevenly available from the various geoscience
societies. The Association of American Geographers has tracked both gender
and ethnicity for decades. The American Geological Society and American
Geophysical Union have tracked gender but not ethnicity. Women comprised
27.6% of AGS membership in 2006 (Rhodes 2008); that year, they constituted
34.3% of the AAG (AAG 2012). In 2006, only 13.7% of the AAG's membership were
members of minority groups, up from 7.4% in 1988.
Meanwhile, the US population in 2010 is considerably more diverse, with 36.2%
of the native-born population in minority groups (US Census 2010). The prime
college age and near-college age cohorts, those between 15 and 29, are even
more diverse, with 40.0% in minority groups. There is, thus, demographic
momentum that the geosciences need to confront, in order to ensure their own
workforce development and expansion.
So, where do we look to attract a more diverse group of students to academic
programs in the geosciences? What do we do once we find them?
Each department is situated in a different locality, which provides access to
different mixes of potential students. Some departments may be located in
large urban areas with "minority-majority" source populations, such as my own
campus, California State University, Long Beach, in the Greater Los Angeles
Area. Urban comprehensive universities in other parts of the country may be
equally diverse but with different specific mixes of ethnicities, such as the
greater prevalence of Puerto Ricans and Dominicans in New England versus
Mexicans and Central Americans in Southern California. Others' campuses may
be located in rural, largely non-Hispanic white regions, which seem
superficially to have less diversity than the urban campuses, but which may
have Indian reservations nearby, such as Montana and Wyoming, or which have
profound economic disparities, as in the Appalachians. Other campuses may
serve areas far from their localities, drawing students from across the
country. Each geoscience department, then, is situated in a service area that
offers different opportunities to engage and recruit a wider population. The
question becomes one of exploring the demographic richness of a particular
locality and trying to find ways to make the geosciences appealing to that
wider community. The geosciences would benefit by tapping into a larger
talent pool and increased geoscience enrollments, and underrepresented student
groups would benefit by taking on an educational path that can lead to
excellent careers and personally satisfying work.
This presentation introduces a GIS-based toolkit developed by the Association
of American Geographers to help geoscience departments do just that, with
funding from the NSF's Opportunities to Enhance Diversity in the Geosciences
(OEDG) Program (NSF Award # 0914645).
This is the Project ALIGNED Toolkit, or Addressing Locally-tailored
Information Infrastructure and Geoscience Needs for Enhancing Diversity. The
Toolkit seeks to align the needs of geoscience departments and
underrepresented students in a place-sensitive fashion by drawing on the
intellectual arsenal of geography and spatial science. It is designed to
provide easier access to better information about a department's local
demographic context to enable knowledge-based action to enhance diversity in
higher education and the geoscience workforce. The project seeks to inform and
transform the ways in which departments and programs envision and realize
their own locally-appropriate goals to enhance diversity, promote inclusion,
and broaden participation. We also seek to provide the data, information,
knowledge, and best practices needed in order to enhance the recruitment and
retention of underrepresented students.
The ALIGNED Toolkit is currently in a beta release. It was originally
available to 13 pilot departments that were joint geology and geography
departments or which had special collaborations between separate geography and
geology programs. Incorporating their feedback and ways of using the Toolkit,
it has been expanded to an additional 56 testing departments of geography
and/or geology. We hope eventually to roll it out for all geography,
geology, earth science, and/or geoscience departments in the United States.
The Toolkit consolidates a variety of data from departments, the U.S. Census
Bureau, the NSF, and the U.S. Department of Education's National Center for
Education Statistics to provide interactive, GIS-based visualizations of
demographic contexts across multiple scales. It also incorporates a
place-based, geographic perspective to support departments in their efforts to
enhance diversity.
At this point, I'd like to walk you through the Toolkit. It is accessed
through http://aagat.tierraplan.com/.
You need your department's login and password, if your department is one of
the pilot or test departments. If your department is not (yet) involved, you
can test-drive the Toolkit, using the example of one of our pilot departments,
the University of Washington, Seattle. The login is guest and the
password is preview.
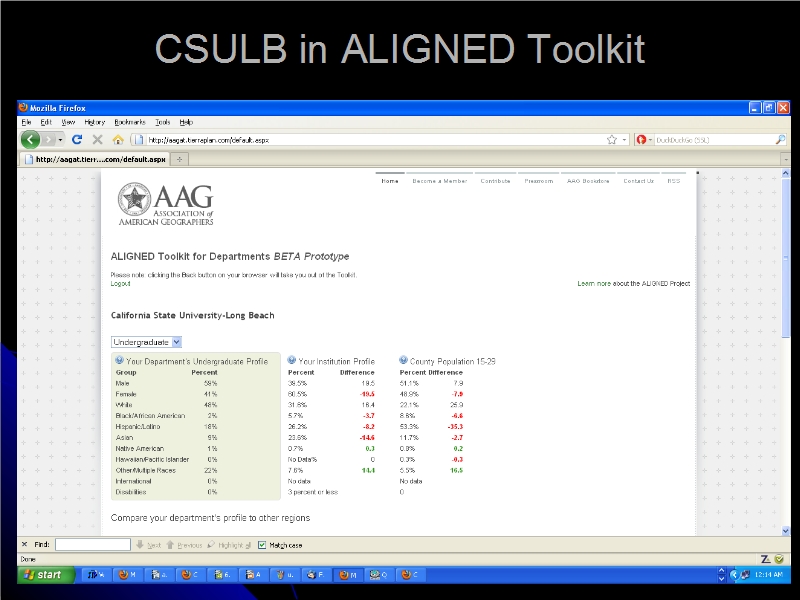
On logging in, you are automatically presented with undergraduate demographics
for the department, the campus, and the county population between the ages of
15 and 29. Significant disparities are highlighted in red (department has
fewer in a given group than the campus or county) or green (department has
more).
Below the initial demographic comparison table is a slider bar, which allows
you to change your population of comparison. Moving it to State provides
demographic comparisons with the State, the State's undergraduate enrollment,
and the State's current high school enrollment. These two comparisons offer
insight into opportunities for potential diversification in the "feeder
school" population, that is, high schools and community colleges. The US
comparison presents the demographics of the national 15-29 population and the
US undergraduate population.
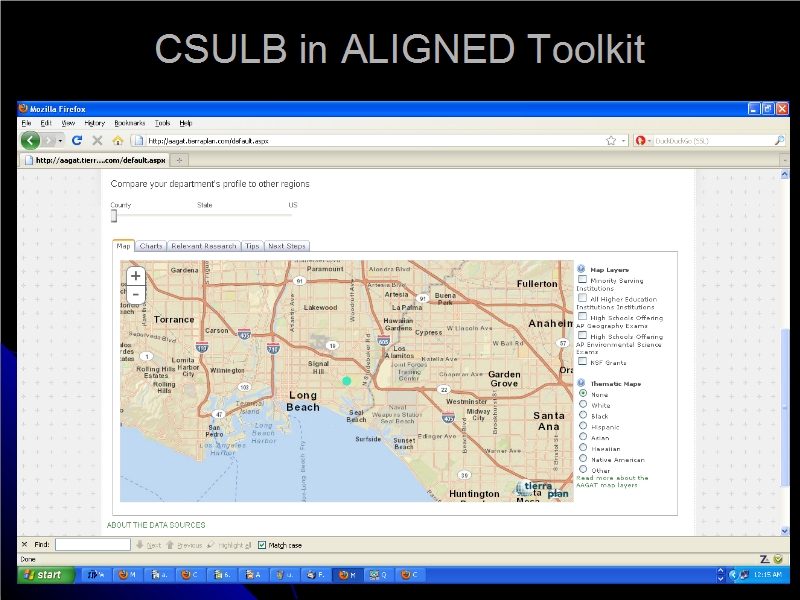
Below the slider appears an interactive map. This offers access to various
data layers. Point data include Minority Serving Institutions, all higher
education institutions in the area (potential competitors or collaborators),
high schools offering an AP Human Geography or an AP Environmental Science
course. The AP Environmental Science course is the one that introduces high
school students to the content of physical geography and geology, as well as
environmental science. Another option is the location of NSF grants. The
point data layers may all be shown at once, each type with a different
cartographic symbol, though that quickly leads to a cluttered map!
The map also offers choropleth maps, which deliver thematic data on races and
ethnic groups, with a color ramp suggesting the relative density of each
group. If you would like to see a legend explaining the quantile breaks, you
click the I button for more information. This produces a popup window with
instructions for viewing the legend. Unlike the additive point data maps, the
choropleth options are either-or.
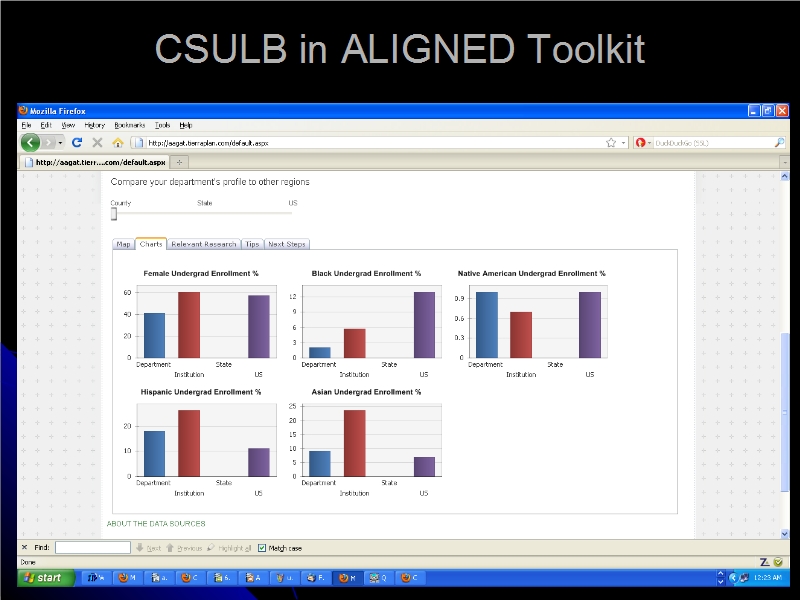
The mapping window offers a tab for presenting demographic comparisons as a
group of bar charts showing a department against its institution, state, and
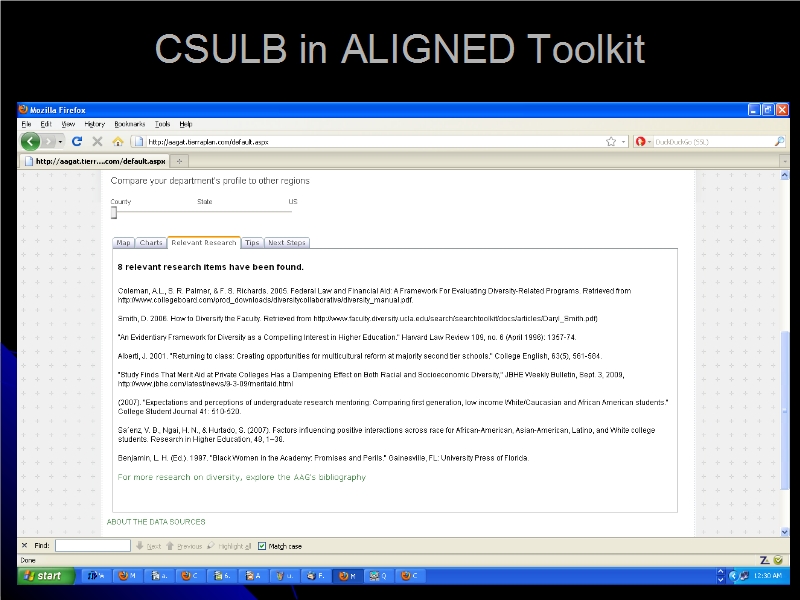
the US as a whole. Another tab offers a list of bibliographic resources
relevant to the goal of diversifying a department's appeal and a link to a
large bibliography housed at the AAG web site. These might be useful jumping
off points for a department or group of departments interested in writing a
grant proposal to support a diversity initiative they have in mind.
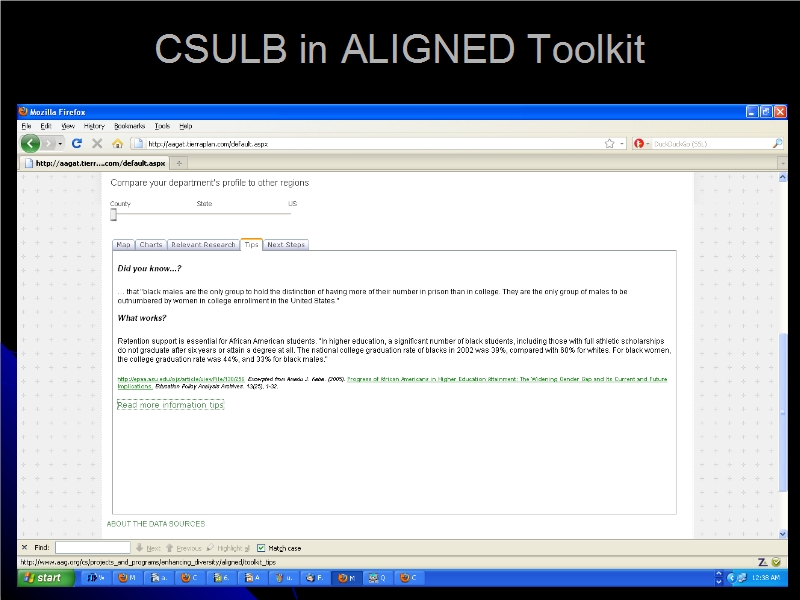
The Tips tab shows a "Did you know...?" statement about an underrepresented
group and a "What works?" suggestion for appealing to that group. It contains
a link leading to a resource on the AAG website, "Informative Tips on Engaging
Various Demographic Groups in Higher Education Geography and Geoscience,"
which contains seven such topics and suggestions and a list of web accessible
references to the sources for these. This resource can give a department a
head start on learning about a group particularly underrepresented in your
program and tailoring a strategy for appealing to potential students from that
group.
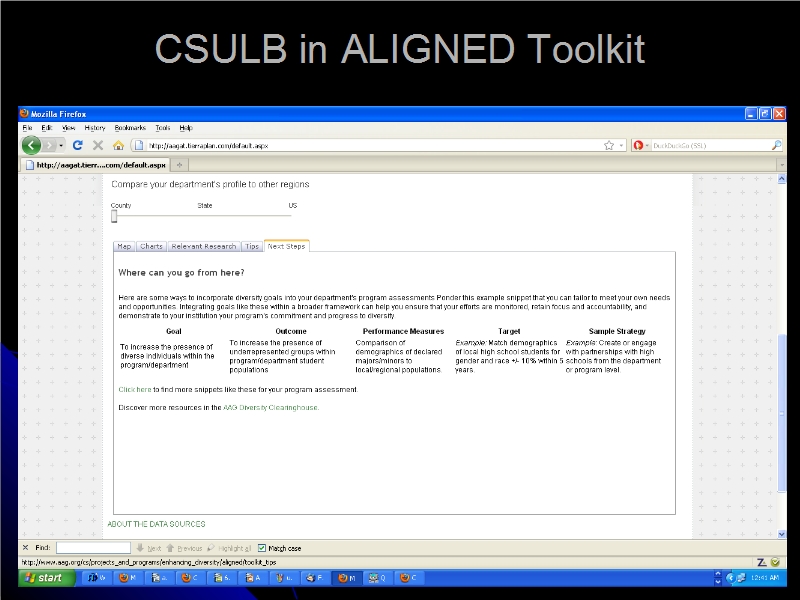
The Next Steps tab provides a template for framing diversity goals into a
department's program assessments, with links to many other examples of
assessment language, called "snippets." You can download an Excel file
containing two dozen snippets. Each leads from a diversity goal to an
outcome, a performance measure, an operational target, and then a sample
strategy for meeting that target. These could be a godsend for a department
trying to respond to campus requests for assessment reports. The Next Steps
tab also provides a link to the AAG Diversity Clearinghouse.
At this point, I'd like to share with you how the Geography and Geological
Sciences programs at California State University, Long Beach, have used the
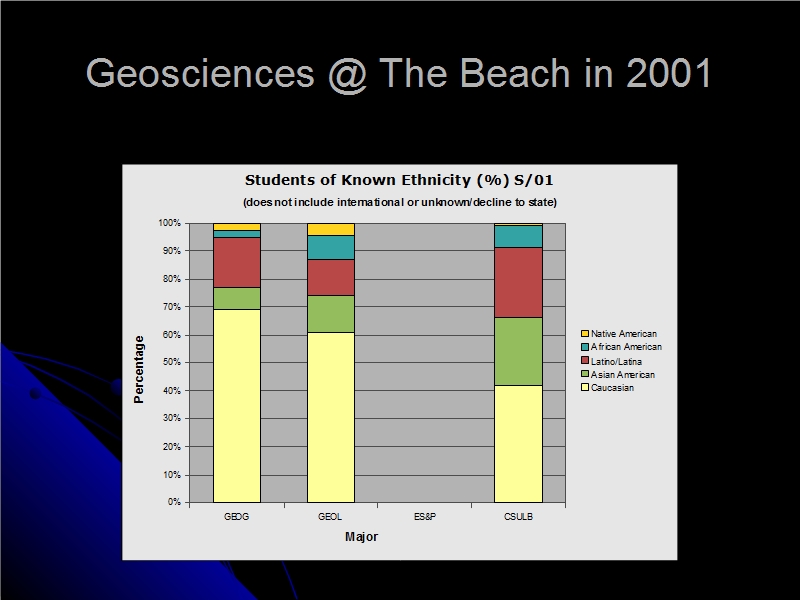
Toolkit. Back in Spring 2001, the two departments started comparing notes on
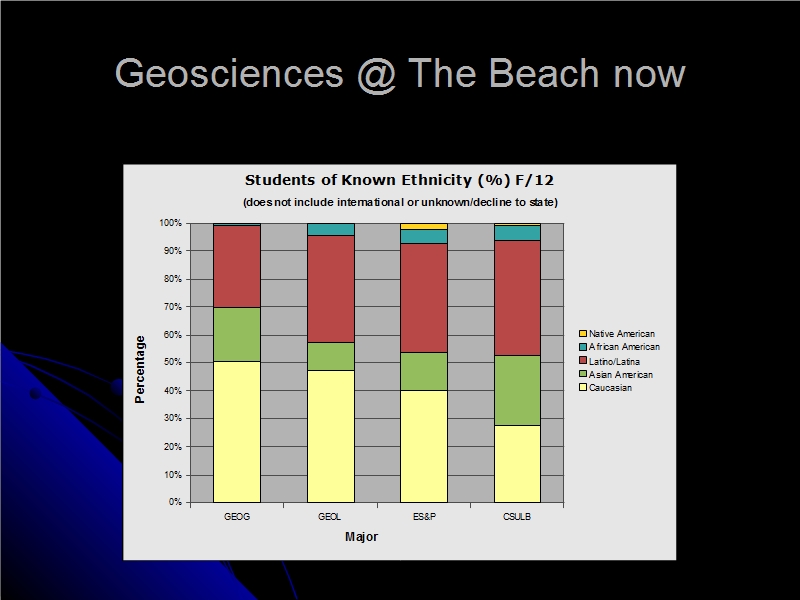
their majors and the demographics of the campus population [ VIEWGRAPH 3 ].
Even though CSULB is a Minority-Serving Institution and a Hispanic-Serving
Institution, you wouldn't know that from the geoscience major compositions.
Geography had 50 majors and Geological Sciences had 36. Of the Geography
students 69% were non-Hispanic white, while 61% of the Geological Science
majors were, while only 42% of the CSULB student population was.
We wrote a major NSF proposal to fund underrepresented students from local
community colleges and high schools to work with us and with their sponsoring
faculty in their home institutions on summer field and lab research projects.
This project, the Geosciences Diversity Enhancement Project or GDEP, drew all
interns into four year degree programs in geoscience majors or minors and it
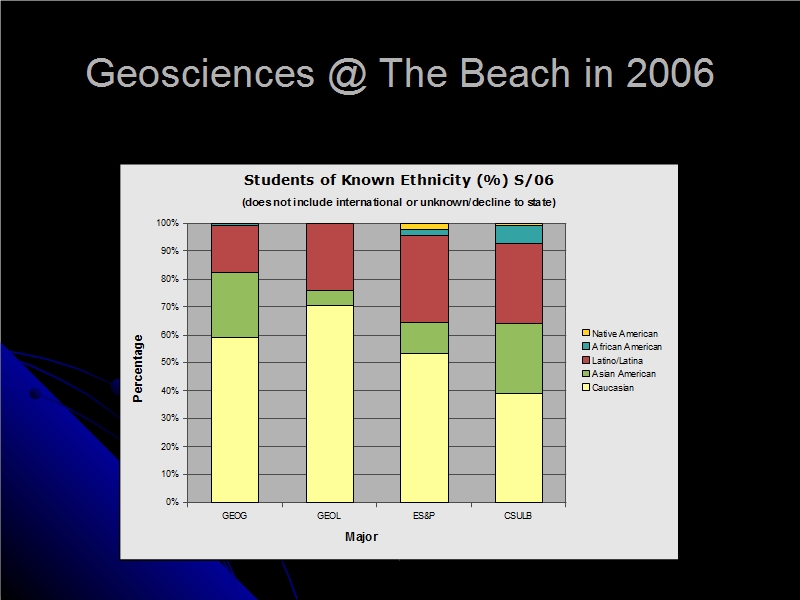
altered faculty teaching habits. GDEP (NSF Award # 0119891)
ran in the summers of 2002-2004 [ VIEWGRAPH 4 ]
and again (NSF Award # 0703798)
from 2008-2010 [ VIEWGRAPH 5 ].
The two departments worked with three others to launch a pair of
interdisciplinary majors in Environmental Sciences and Policy, beginning in
2003. [ VIEWGRAPH 6
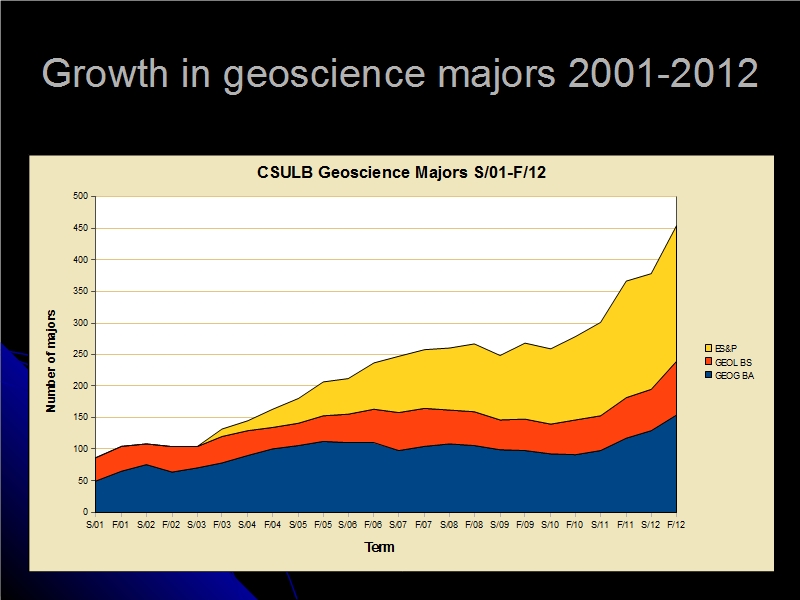
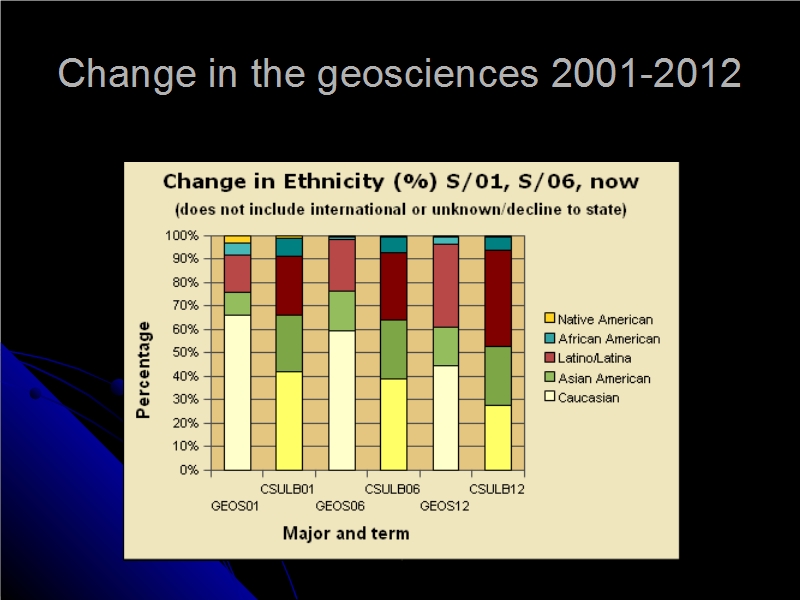
]The upshot of these collaborations is an explosion in the number of
geoscience majors on our campus, from 86 in Spring of 2001 to 454 today
(Geography with 154, Geological Sciences with 85, and ES&P with 215). Their
diversity has also increased: While non-Hispanic white majors have more than
trebled from 2001 to 2012, minority majors have gone up by an order of
magnitude [ VIEWGRAPH 7 ]!
This collaboration was the basis of our inclusion among the pilot programs in
Project ALIGNED.
As the Toolkit has evolved, we have experimented with it. [ VIEWGRAPH 8
]The tables it generates show that we still have a long way to go before our
major demographics approach those of the campus and the surrounding
communities [ VIEWGRAPH 9 ].
We can't rest on our GDEP laurels [ VIEWGRAPH 10
], and the Toolkit allows us to identify areas we should target. The focus of
GDEP was ethnic diversity, but the Toolkit shows that we have perhaps
overlooked gender balance. The campus is 61% female, but our programs average
48% female. ES&P is 56% female; Geological Sciences is 45% female; and
Geography brings up the rear with 34% female this semester. For all the
success our departments have had with improving our appeal to Latino students
and Asian students, we have lost some ground with African-American students.
The Toolkit has drawn our attention to our lack of success in appealing to
female and to black students. We wish the Toolkit had been available back in
2001 when we were working on the GDEP proposal: It would have saved us a lot
of work rummaging around in Institutional Research and Census databases.
The Toolkit doesn't just provide sobering snapshots: It incorporates access
to helpful resources. [ VIEWGRAPH 11
]One of these is the Relevant Research tab on the map window. It allows you
to download a large bibliography of research on a wide array of diversity
dimensions, diversity resources in geography, the geosciences more generally,
and the STEM fields. For our needs, there's a large section on women and
girls and also on African-Americans. [ VIEWGRAPH 12 ]
The Tips tab focusses on African-American students because that was the group
we've done the worst in reaching.
[ VIEWGRAPH
13 ]. The Toolkit also includes assessment tools, the snippets written in
assessment language. Our campus requires every department to engage in at
least one assessment project per year and, since we would like to investigate
our lack of success in recruiting women and black students, we will be
tailoring snippets from the first section to set achievable goals with
measurable outcomes and then adapt the sample strategies provided. This
should help us work on our diversity goals and let us meet campus requirements
for assessment projects.
[ VIEWGRAPH
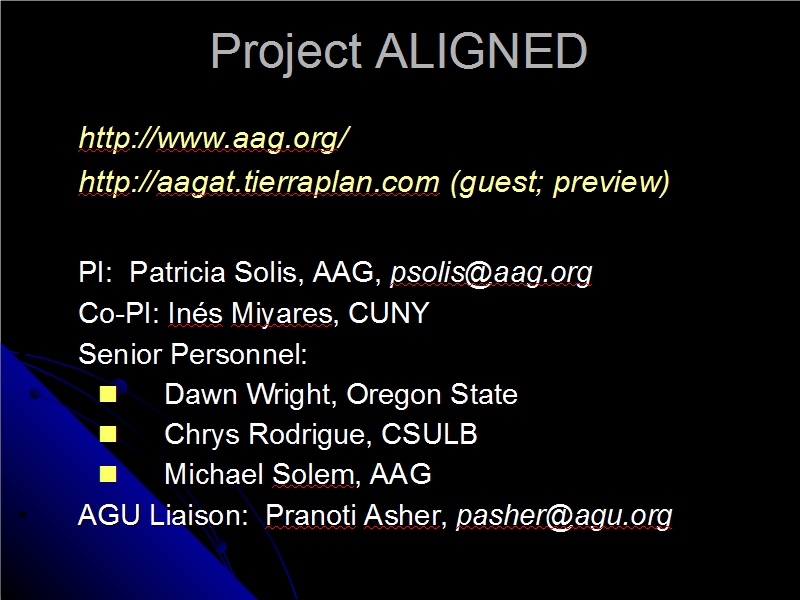
14 ] If your department is not already involved with Project ALIGNED and
you think the ALIGNED Toolkit would be useful to your department or program,
please request involvement by contacting Patricia Solis, the PI for Project
ALIGNED at AAG headquarters, or Pranoti Asher, Manager of AGU Education and
Public Outreach. Any of us among the investigators, senior personnel, or
AAG-AGU liaisons would be pleased to talk with you in greater detail about
Project ALIGNED and the Toolkit: http://www.aag.org/cs/projects_and_programs/enhancing_diversity/aag_diversity_programs.
For more information on the AGU Diversity Plan: http://education.agu.org/diversity-programs/agu-diversity-plan/.

Project ALIGNED Team
PI: Patricia Solis, AAG,
psolis@aag.org
Co-PI: Inés Miyares, CUNY
Senior Personnel:
AGU Liaison: Pranoti Asher,
pasher@agu.org
The Project ALIGNED team wishes to thank the National Science Foundation for
funding the development of the Toolkit described in this paper. Project
ALIGNED was funded under NSF Award # 0914645.
