.gif)
Kinetic Waves
Standing waves and traveling waves represent the two special cases limiting a wide range of wave behavior. This wave behavior is represented in the following static graphs and kinetic displays. 3-D complex exponential waves in a medium with damping are used to demonstrate this behavior.
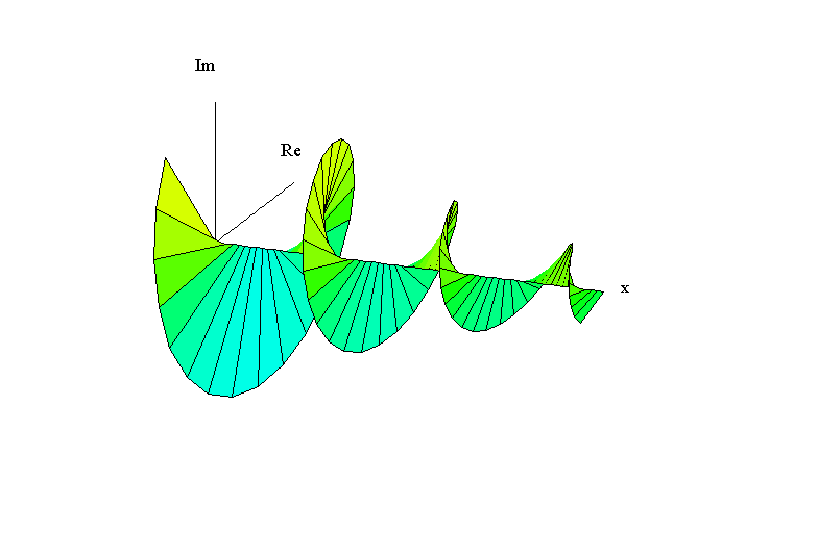
Single Traveling Complex Wave
We begin with a complex exponential wave in a medium with damping. The equation takes the form:
f(x) = e-a x ei(kx-Tt) (1)
where a is the damping factor.
The following is a static graph of this wave when alpha = 0.5
.gif)
Superposition of Reflected Complex Exponential Waves
The superposition of a reflected wave and an incident wave in a medium with damping has the form:
f(x) = e-iTt (e-a x eikx + R ea x e-ikx) (2)
The damping factor is alpha and the reflection coefficient is R. The static graph shown earlier is actually a just the incident wave at t=0. This can be verified by setting R=0 and t=0 in equation (2) to obtain equation (1).
A kinetic display in three dimensions uses the y-axis for the real part and the z-axis for the imaginary part of the total wave.

In order to view this kinetic image, you must have a program called " DP Graph Viewer" (900kb).
-- Click Installation Guide to down load DP Graph Viewer.
-- To learn how to rotate, zoom in/out, and change parameters of the graph click on this
guide: Helix User Guide.
If you have installed the DP Graph Viewer, then click on "Kinetic Helix" below to see this kinetic display in action.
(Hint: The display begins with a view from the top showing y versus x for an undamped traveling wave. To see 3-D angles or adjust wave parameters - damping, reflection coefficient, etc. - click on Helix User Guide)
The following static images and explanations provide a guide for exploring the complex exponential wave. The scrollbar parameters and orientation of the graphs are described underneath each link.
-- For all of the images below, adjust the orientation and zoom with the arrows, page up, and
page down buttons. To learn how to adjust the scroll bar parameters, first refer to Helix User Guide.
Set the propagation number ("c") and angular frequency ("d") to any value.
Undamped Standing Wave (This figure has b=1)
Set the reflection coefficient ("b") to it's minimum of -1 (to form a node at x=0) or to it's maximum of 1 (to form an antinode at x=0).
Undamped Lurching Wave (This figure has b=.35)
Set the reflection coefficient ("b") to locations other than the minimum (-1), maximum (1), or middle (0). To do this, adjust the scrollbar for "b" to any location other than the top, bottom, or middle. Observe the lurching behavior of the imperfect standing wave (the lurching wave).
Damped Traveling Wave (This figure has a=.15)
Set the damping factor ("a") to nonzero values to observe the damped traveling wave.
Damped Lurching Wave (This figure has a=.15 and b=1)
Set the damping factor ("a") to it's maximum of .15. Then adjust the reflection coefficient ("b") to it's minimum (-1) or maximum (1).
-- Note: As you view the wave at the tip of the positive x-axis and proceed toward the origin, you can see the transition
from a traveling wave behavior, to a lurching wave behavior and finally a standing wave behavior near the origin.
Notice in particular how nodes become less perfect as you move from the origin (where there is reflection) to the tip of
the x-axis where the reflected wave is almost completely damped out.
![]()