
H.Tahsiri
Off[General::spell];
Off[General::spell1];
Clear["Global`*"];
(* ydata as a function of t, given in the above reference,is enterd as {t,y} *)
ydata={{0,1.04},{.25,.63},{.50,.20},{.75,-.22},
{1,-.65},{1.25,-1.03},{1.50,-1.37},{1.75,-1.58},
{2.00,-1.59},{2.25,-1.32},{2.50,-.79},{2.75,-.11},
{3.00,.58},{3.25,1.22},{3.50,1.82},{3.75,2.35},
{4.00,2.81},{4.25,3.22},{4.50,3.59},{4.75,3.90},
{5.00,4.16},{5.25,4.40},{5.50,4.58},{5.75,4.74},
{6.00,4.86},{6.25,4.95},{6.50,5.01},{6.75,5.03},
{7.00,5.04},{7.25,5.00},{7.50,4.95},{7.75,4.87},
{8.00,4.77},{8.25,4.65},{8.50,4.50},{8.75,4.33},
{9.00,4.14},{9.25,3.93},{9.50,3.69},{9.75,3.42},
{10.00,3.15},{10.25,2.85},{10.50,2.52},{10.75,2.20},
{11.00,1.83},{11.25,1.46},{11.50,1.06},{11.75,.65}}

     {{0, 1.04}, {0.25, 0.63}, {0.5, 0.2}, {0.75, -0.22}, {1, -0.65}, {1.25, -1.03}, {1.5, -1.37},

       {1.75, -1.58}, {2., -1.59}, {2.25, -1.32}, {2.5, -0.79}, {2.75, -0.11}, {3., 0.58},

       {3.25, 1.22}, {3.5, 1.82}, {3.75, 2.35}, {4., 2.81}, {4.25, 3.22}, {4.5, 3.59}, {4.75, 3.9},

       {5., 4.16}, {5.25, 4.4}, {5.5, 4.58}, {5.75, 4.74}, {6., 4.86}, {6.25, 4.95}, {6.5, 5.01},

       {6.75, 5.03}, {7., 5.04}, {7.25, 5.}, {7.5, 4.95}, {7.75, 4.87}, {8., 4.77}, {8.25, 4.65},

       {8.5, 4.5}, {8.75, 4.33}, {9., 4.14}, {9.25, 3.93}, {9.5, 3.69}, {9.75, 3.42}, {10., 3.15},

       {10.25, 2.85}, {10.5, 2.52}, {10.75, 2.2}, {11., 1.83}, {11.25, 1.46}, {11.5, 1.06},

       {11.75, 0.65}}
(* xdata as a function of t, given in the Manual, is enterd as {t,x} *)
xdata={{0,-3.62},{.25,-3.46},{.50,-3.25},{.75,-2.97},
{1,-2.60},{1.25,-2.14},{1.50,-1.55},{1.75,-.85},
{2.00,-.03},{2.25,.78},{2.50,1.45},{2.75,1.87},
{3.00,2.09},{3.25,2.16},{3.50,2.11},{3.75,1.99},
{4.00,1.82},{4.25,1.61},{4.50,1.37},{4.75,1.11},
{5.00,.85},{5.25,.58},{5.50,.28},{5.75,0},
{6.00,-.27},{6.25,-.56},{6.50,-.84},{6.75,-1.12},
{7.00,-1.38},{7.25,-1.64},{7.50,-1.89},{7.75,-2.14},
{8.00,-2.37},{8.25,-2.59},{8.50,-2.80},{8.75,-2.99},
{9.00,-3.17},{9.25,-3.33},{9.50,-3.49},{9.75,-3.59},
{10.00,-3.69},{10.25,-3.77},{10.50,-3.81},{10.75,-3.83},
{11.00,-3.81},{11.25,-3.75},{11.50,-3.65},{11.75,-3.51}}

     {{0, -3.62}, {0.25, -3.46}, {0.5, -3.25}, {0.75, -2.97}, {1, -2.6}, {1.25, -2.14},

       {1.5, -1.55}, {1.75, -0.85}, {2., -0.03}, {2.25, 0.78}, {2.5, 1.45}, {2.75, 1.87},

       {3., 2.09}, {3.25, 2.16}, {3.5, 2.11}, {3.75, 1.99}, {4., 1.82}, {4.25, 1.61}, {4.5, 1.37},

       {4.75, 1.11}, {5., 0.85}, {5.25, 0.58}, {5.5, 0.28}, {5.75, 0}, {6., -0.27}, {6.25, -0.56},

       {6.5, -0.84}, {6.75, -1.12}, {7., -1.38}, {7.25, -1.64}, {7.5, -1.89}, {7.75, -2.14},

       {8., -2.37}, {8.25, -2.59}, {8.5, -2.8}, {8.75, -2.99}, {9., -3.17}, {9.25, -3.33},

       {9.5, -3.49}, {9.75, -3.59}, {10., -3.69}, {10.25, -3.77}, {10.5, -3.81}, {10.75, -3.83},

       {11., -3.81}, {11.25, -3.75}, {11.5, -3.65}, {11.75, -3.51}}
y[t_]=Interpolation[ydata][t]

     InterpolatingFunction[{{0, 11.75}}, <>][t]
x[t_]=Interpolation[xdata][t]

     InterpolatingFunction[{{0, 11.75}}, <>][t]
p1=Plot[Evaluate[y[t]],{t,0,11.56},
		Epilog->Map[{PointSize[0.02],Point[#]}&,ydata]];
![[Graphics:keplergr1.gif]](keplergr1.gif)
Clear[vy]
vy[t_]=y'[t]

     InterpolatingFunction[{{0, 11.75}}, <>][t]
vytable=Table[{t,vy[t]},{t,0,11.56,.2}];
p11=Plot[Evaluate[vy[t]],{t,0,11.56}];
![[Graphics:keplergr3.gif]](keplergr3.gif)
p2=Plot[Evaluate[x[t]],{t,0,11.56},
		Epilog->Map[{PointSize[0.02],Point[#]}&,xdata]];
![[Graphics:keplergr4.gif]](keplergr4.gif)
vx[t_]=x'[t]

     InterpolatingFunction[{{0, 11.75}}, <>][t]
p22=Plot[Evaluate[vx[t]],{t,0,11.56},PlotRange->All];
vxtable=Table[{t,vx[t]},{t,0,11.56,.2}];
Clear[v]
v[t_]=Sqrt[vx[t]^2+vy[t]^2]

                                                    2                                             2
     Sqrt[InterpolatingFunction[{{0, 11.75}}, <>][t]  + InterpolatingFunction[{{0, 11.75}}, <>][t] ]
vtable=Table[{t,v[t]},{t,0,11.56,.2}];
p3=ParametricPlot[Evaluate[{x[t],y[t]}],{t,0,11.56},AspectRatio->Automatic];
![[Graphics:keplergr5.gif]](keplergr5.gif)
s1=Map[Take[#,{2,2}]&,xdata];
s2=Map[Take[#,{2,2}]&,ydata];
s3=Flatten[Thread[{s1,s2}]];
s4=Partition[s3,2];
(* r=Sqrt[x^2+y^2] *)
r1=Sqrt[s4[[1,1]]^2+s4[[1,2]]^2]
     3.76643
r2=Sqrt[s4[[2,1]]^2+s4[[2,2]]^2]
     3.51689
Clear[radi]
radi=Table[{Sqrt[s4[[i,1]]^2+s4[[i,2]]^2]},{i,1,Length[s4]}];
(* As shown bellow, rmin=1.53323 and rmax=5.32633*)
Sort[radi];
(* semimajor Axis=a *)
a=((rmin+rmax)/2)/.{rmin->1.53323,rmax->5.32633}

     3.42978
(*ecen=e *)
Clear[e]
e=(rmax-rmin)/(2a)/.{rmax->5.3263,rmin->1.53323,a->3.42978}

0.552961
(* semiminor=b *)
b=a Sqrt[(1-e^2)/.{a->3.42978,e->.552961}]

2.85772
Clear[a,e,b,r]
r=Sqrt[(x-a e)^2+y^2]
(* This is Vis Viva orbit equations *)
v1=Sqrt[G M ((2/r)-(1/a))]
given={G->8.642 10^(-13),M->7.35 10^22,a->3.42978*1738,e->.552961}
![[Graphics:keplergr2.gif]](keplergr2.gif)
![[Graphics:keplergr8.gif]](keplergr8.gif)
v2=v1/.given//N
(* x and y values at t=1 hr. See lab table *)
v3=v2/1000/.{x->-2.6*1738,y->-.65*1738}

2.3308
(* the abov theoretical value of speed is in an
	excellent agreement with the experiment *)
s5=ListPlot[s4,PlotJoined->True,PlotRange->All,AspectRatio->Automatic];
![[Graphics:keplergr10.gif]](keplergr10.gif)
s6=ListPlot[s4,PlotJoined->True,AspectRatio->Automatic,
				Epilog->Map[{PointSize[0.02],Point[#]}&,s4]];
![[Graphics:keplergr11.gif]](keplergr11.gif)
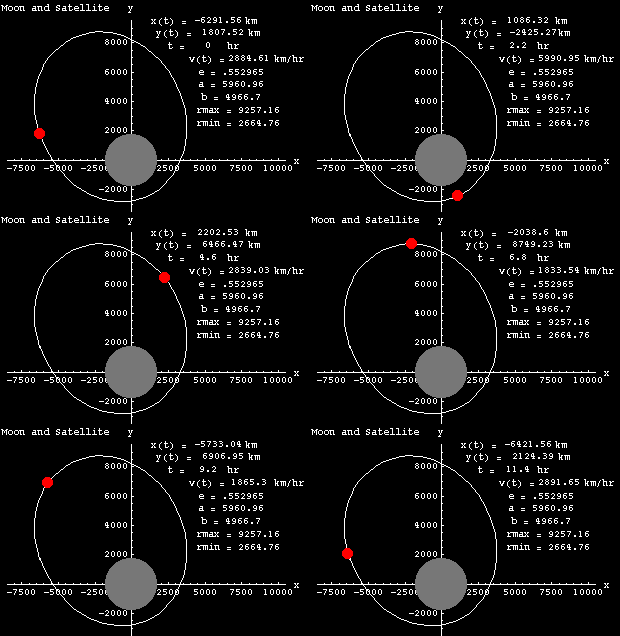
cont=	 Epilog->{{Text["x(t) = ",{1.7,5.5}]},{Text[x[i],{3.2,5.5}]},{Text["y(t) = ",{1.7,5}]},{Text[y[i],{3.2,5}]},
			{Text["t = ",{2,4.5}]},{Text[i,{3,4.5}]},
			{Text["v(t) = ",{3.1,4}]},{Text[v[i],{4.6,4}]},
			Text["Moon and Satellite",{-3,6}],
			Text["e = .553",{3.9,3.5}],
			Text["a = 3.43",{3.9,3}],
			Text["b = 2.86",{3.9,2.5}],
			Text["rmax = 5.33",{3.9,2}],
			Text["rmin = 1.53",{3.9,1.5}]}
![[Graphics:keplergr2.gif]](keplergr2.gif)
![[Graphics:keplergr12.gif]](keplergr12.gif)
s6=Do[Show[p3,
			Graphics[{GrayLevel[.5],PointSize[.19],Point[{0,0}],RGBColor[1,0,0],PointSize[0.04],Point[{x[i],y[i]}] } ], cont,PlotRange->{{-5,5},{-2,6}},AxesLabel->{x,  y},Background->RGBColor[0,0,0],Frame->False],
		{i,0,0}];
![[Graphics:keplergr13.gif]](keplergr13.gif)