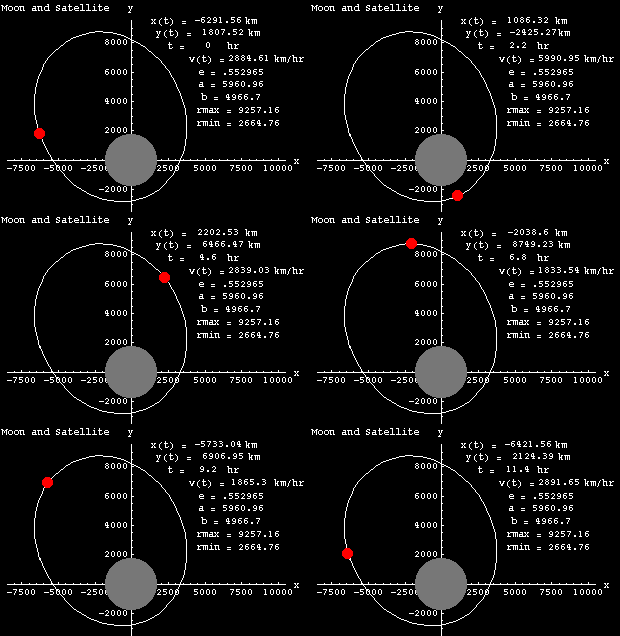

The following program is not a compact code. I purposely coded loosly for the purpose of learnig Mathematica in steps. Please email me if you are interested to know more about how to use Mathematica in education or in research.
Click for more Mathematica programming Problems/solutions with Mathematica
H.Tahsiri
Off[General::spell];
Off[General::spell1];
Clear["Global`*"];

(*  ydata as a function of t, given in the above reference,is enterd as {t,y} *)
ydata={{0,1.04},{.25,.63},{.50,.20},{.75,-.22},
{1,-.65},{1.25,-1.03},{1.50,-1.37},{1.75,-1.58},
{2.00,-1.59},{2.25,-1.32},{2.50,-.79},{2.75,-.11},
{3.00,.58},{3.25,1.22},{3.50,1.82},{3.75,2.35},
{4.00,2.81},{4.25,3.22},{4.50,3.59},{4.75,3.90},
{5.00,4.16},{5.25,4.40},{5.50,4.58},{5.75,4.74},
{6.00,4.86},{6.25,4.95},{6.50,5.01},{6.75,5.03},
{7.00,5.04},{7.25,5.00},{7.50,4.95},{7.75,4.87},
{8.00,4.77},{8.25,4.65},{8.50,4.50},{8.75,4.33},
{9.00,4.14},{9.25,3.93},{9.50,3.69},{9.75,3.42},
{10.00,3.15},{10.25,2.85},{10.50,2.52},{10.75,2.20},
{11.00,1.83},{11.25,1.46},{11.50,1.06},{11.75,.65}}

     {{0, 1.04}, {0.25, 0.63}, {0.5, 0.2}, {0.75, -0.22}, {1, -0.65}, {1.25, -1.03}, {1.5, -1.37},

       {1.75, -1.58}, {2., -1.59}, {2.25, -1.32}, {2.5, -0.79}, {2.75, -0.11}, {3., 0.58},

       {3.25, 1.22}, {3.5, 1.82}, {3.75, 2.35}, {4., 2.81}, {4.25, 3.22}, {4.5, 3.59}, {4.75, 3.9},

       {5., 4.16}, {5.25, 4.4}, {5.5, 4.58}, {5.75, 4.74}, {6., 4.86}, {6.25, 4.95}, {6.5, 5.01},

       {6.75, 5.03}, {7., 5.04}, {7.25, 5.}, {7.5, 4.95}, {7.75, 4.87}, {8., 4.77}, {8.25, 4.65},

       {8.5, 4.5}, {8.75, 4.33}, {9., 4.14}, {9.25, 3.93}, {9.5, 3.69}, {9.75, 3.42}, {10., 3.15},

       {10.25, 2.85}, {10.5, 2.52}, {10.75, 2.2}, {11., 1.83}, {11.25, 1.46}, {11.5, 1.06},

       {11.75, 0.65}}
(* xdata as a function of t, given in the Manual, is enterd as {t,x} *)
xdata={{0,-3.62},{.25,-3.46},{.50,-3.25},{.75,-2.97},
{1,-2.60},{1.25,-2.14},{1.50,-1.55},{1.75,-.85},
{2.00,-.03},{2.25,.78},{2.50,1.45},{2.75,1.87},
{3.00,2.09},{3.25,2.16},{3.50,2.11},{3.75,1.99},
{4.00,1.82},{4.25,1.61},{4.50,1.37},{4.75,1.11},
{5.00,.85},{5.25,.58},{5.50,.28},{5.75,0},
{6.00,-.27},{6.25,-.56},{6.50,-.84},{6.75,-1.12},
{7.00,-1.38},{7.25,-1.64},{7.50,-1.89},{7.75,-2.14},
{8.00,-2.37},{8.25,-2.59},{8.50,-2.80},{8.75,-2.99},
{9.00,-3.17},{9.25,-3.33},{9.50,-3.49},{9.75,-3.59},
{10.00,-3.69},{10.25,-3.77},{10.50,-3.81},{10.75,-3.83},
{11.00,-3.81},{11.25,-3.75},{11.50,-3.65},{11.75,-3.51}}

     {{0, -3.62}, {0.25, -3.46}, {0.5, -3.25}, {0.75, -2.97}, {1, -2.6}, {1.25, -2.14},

       {1.5, -1.55}, {1.75, -0.85}, {2., -0.03}, {2.25, 0.78}, {2.5, 1.45}, {2.75, 1.87},

       {3., 2.09}, {3.25, 2.16}, {3.5, 2.11}, {3.75, 1.99}, {4., 1.82}, {4.25, 1.61}, {4.5, 1.37},

       {4.75, 1.11}, {5., 0.85}, {5.25, 0.58}, {5.5, 0.28}, {5.75, 0}, {6., -0.27}, {6.25, -0.56},

       {6.5, -0.84}, {6.75, -1.12}, {7., -1.38}, {7.25, -1.64}, {7.5, -1.89}, {7.75, -2.14},

       {8., -2.37}, {8.25, -2.59}, {8.5, -2.8}, {8.75, -2.99}, {9., -3.17}, {9.25, -3.33},

       {9.5, -3.49}, {9.75, -3.59}, {10., -3.69}, {10.25, -3.77}, {10.5, -3.81}, {10.75, -3.83},

       {11., -3.81}, {11.25, -3.75}, {11.5, -3.65}, {11.75, -3.51}}
y[t_]=Interpolation[ydata][t]

     InterpolatingFunction[{{0, 11.75}}, <>][t]
x[t_]=Interpolation[xdata][t]

     InterpolatingFunction[{{0, 11.75}}, <>][t]
p1=Plot[Evaluate[y[t]],{t,0,11.56},
		Epilog->Map[{PointSize[0.02],Point[#]}&,ydata]];
![[Graphics:keplergr1.gif]](keplergr1.gif)
Clear[vy]
vy[t_]=y'[t]

     InterpolatingFunction[{{0, 11.75}}, <>][t]
vytable=Table[{t,vy[t]},{t,0,11.56,.2}];
p11=Plot[Evaluate[vy[t]],{t,0,11.56}];
![[Graphics:keplergr3.gif]](keplergr3.gif)
p2=Plot[Evaluate[x[t]],{t,0,11.56},
		Epilog->Map[{PointSize[0.02],Point[#]}&,xdata]];
![[Graphics:keplergr4.gif]](keplergr4.gif)
vx[t_]=x'[t]

     InterpolatingFunction[{{0, 11.75}}, <>][t]
p22=Plot[Evaluate[vx[t]],{t,0,11.56},PlotRange->All];
vxtable=Table[{t,vx[t]},{t,0,11.56,.2}];
Clear[v]
v[t_]=Sqrt[vx[t]^2+vy[t]^2]

                                                    2                                             2
     Sqrt[InterpolatingFunction[{{0, 11.75}}, <>][t]  + InterpolatingFunction[{{0, 11.75}}, <>][t] ]
vtable=Table[{t,v[t]},{t,0,11.56,.2}];
p3=ParametricPlot[Evaluate[{x[t],y[t]}],{t,0,11.56},AspectRatio->Automatic];
![[Graphics:keplergr5.gif]](keplergr5.gif)
s1=Map[Take[#,{2,2}]&,xdata];
s2=Map[Take[#,{2,2}]&,ydata];
s3=Flatten[Thread[{s1,s2}]];
s4=Partition[s3,2];
(* r=Sqrt[x^2+y^2] *)
r1=Sqrt[s4[[1,1]]^2+s4[[1,2]]^2]
     3.76643
r2=Sqrt[s4[[2,1]]^2+s4[[2,2]]^2]
     3.51689
Clear[radi]
radi=Table[{Sqrt[s4[[i,1]]^2+s4[[i,2]]^2]},{i,1,Length[s4]}];
(* As shown bellow, rmin=1.53323 and rmax=5.32633*)
Sort[radi];
(* semimajor Axis=a *)
a=((rmin+rmax)/2)/.{rmin->1.53323,rmax->5.32633}

     3.42978
(*ecen=e *)
Clear[e]
e=(rmax-rmin)/(2a)/.{rmax->5.3263,rmin->1.53323,a->3.42978}

0.552961
(* semiminor=b *)
b=a Sqrt[(1-e^2)/.{a->3.42978,e->.552961}]

2.85772
Clear[a,e,b,r]
r=Sqrt[(x-a e)^2+y^2]
(* This is Vis Viva orbit equations *)
v1=Sqrt[G M ((2/r)-(1/a))]
given={G->8.642 10^(-13),M->7.35 10^22,a->3.42978*1738,e->.552961}
![[Graphics:keplergr2.gif]](keplergr2.gif)
![[Graphics:keplergr8.gif]](keplergr8.gif)
v2=v1/.given//N
(* x and y values at t=1 hr. See lab table *)
v3=v2/1000/.{x->-2.6*1738,y->-.65*1738}

2.3308
(* the abov theoretical value of speed is in an
	excellent agreement with the experiment *)
s5=ListPlot[s4,PlotJoined->True,PlotRange->All,AspectRatio->Automatic];
![[Graphics:keplergr10.gif]](keplergr10.gif)
s6=ListPlot[s4,PlotJoined->True,AspectRatio->Automatic,
				Epilog->Map[{PointSize[0.02],Point[#]}&,s4]];
![[Graphics:keplergr11.gif]](keplergr11.gif)
cont=	 Epilog->{{Text["x(t) = ",{1.7,5.5}]},{Text[x[i],{3.2,5.5}]},{Text["y(t) = ",{1.7,5}]},{Text[y[i],{3.2,5}]},
			{Text["t = ",{2,4.5}]},{Text[i,{3,4.5}]},
			{Text["v(t) = ",{3.1,4}]},{Text[v[i],{4.6,4}]},
			Text["Moon and Satellite",{-3,6}],
			Text["e = .553",{3.9,3.5}],
			Text["a = 3.43",{3.9,3}],
			Text["b = 2.86",{3.9,2.5}],
			Text["rmax = 5.33",{3.9,2}],
			Text["rmin = 1.53",{3.9,1.5}]}
![[Graphics:keplergr2.gif]](keplergr2.gif)
![[Graphics:keplergr12.gif]](keplergr12.gif)
s6=Do[Show[p3,
			Graphics[{GrayLevel[.5],PointSize[.19],Point[{0,0}],RGBColor[1,0,0],PointSize[0.04],Point[{x[i],y[i]}] } ], cont,PlotRange->{{-5,5},{-2,6}},AxesLabel->{x,  y},Background->RGBColor[0,0,0],Frame->False],
		{i,0,0}];
![[Graphics:keplergr13.gif]](keplergr13.gif)