ABSTRACT: This article presents evidence from statistical data, statistical models, and electoral surveys indicating strongly that the substantial victory of Reagan and the Republicans in 1980 was the predictable consequence of poor economic performance under Carter and the Democrats and did not represent an ideological "shift to the right" by the electorate.. The latter part of the article discusses the implications of this conclusion for public support for the Reagan administration's social and economic program, and for the Republican party's political prospects in 1982 and 1984.
      "This campaign was about the failure of Jimmy Carter--about the
way he messed up our economy and our standing in the world.

            --William Casey, former Campaign Manager, Reagan-Bush
                             Committee. [1]


"1980 was not a watershed election. According to all the
post-election surveys we've done, the people wanted change in this
election. They haven't necessarily ratified what we stand for. We
have this great opportunity in the next years  to show what we stand
for works."

           -- Paul Weyrich, head of the New Right's Committee for the
                            Survival of a Free Congress, quoted in
                            Orren and Dionne, (1981: 27).
The 1980 elections obviously represented a substantial victory for Ronald Reagan and the Republican Party. Mr. Reagan received 55.3% of the two-party vote (50.8% of all v votes cast) and was the first challenger to defeat an elected, incumbent president since Roosevelt beat Hoover in 1932 The Democratic Party's share of the popular vote for the House of Representatives fell three percentage points (from 53.4% in 1978 to 50.4%) and they lost 33 seats (from 276 to 243), [2] a decline of 7.6% in their House strength. Democratic losses (Republican gains) were even heavier in the Senate. The Democrats lost 12 seats (from 58 to 46); as a result the Republicans now enjoy their first Senate majority since 1954. [3] Among the victims of the debacle were more than a half dozen well-known liberal Democratic senators: McGovern (South Dakota), Bayh (Indiana), Culver (lowa), Magnuson (Washington), Durkin (New Hampshire), Nelson (Wisconsin), and Church (Idaho).
Put simply, there are two ways to interpret the 1980 election outcomes. One interpretation, more popular among journalists and Republicans in or close to the administration than among academic specialists, is that the election results reflect a fundamental "shift to the right" of the electorate's preferences concerning the federal government's role in domestic social and economic affairs. [4] According to this view, the election signaled a dramatic erosion of political support for federal economic intervention and social welfare efforts that began with Franklin Roosevelt's New Deal legislation in the 1930s and reached maturity with Lyndon Johnson's Great Society programs in the 1960s. By this interpretation, 1980 was therefore a watershed election in which a majority of voters soundly rejected federal activism and welfare state policies sustained under Carter and the Democrats.
An alternative interpretation is that the 1980 election outcomes represent the predictable consequences of poor performance; particularly poor macroeconomic performance--under Carter and the Democrats. The 1980 election results therefore should be seen as a referendum on the incumbents' (mis)handling of economy and perhaps other problems. [5] Ironically, it follows from this view that the 1980 political successes of Ronald Reagan and Francois Mitterand have common origins. Both the American Republican and the French Socialist candidates (and their respective parties) were the political beneficiaries of the restrictive economic policies embraced by the Carter and Giscard d'Estaing governments to fight inflation. [6] According to this view, then, any president and incumbent party going before the electorate with the record of Carter and the Democrats would have been in deep political trouble, and virtually any credible challenge to the president and the in-party--from the left or the right--would have been successful. Hence the 1980 election results reflect neither an ideological watershed nor a rejection of liberal social policies, but rather represent a repudiation of the Carter administration's poor performance.
These alternative interpretations of the 1980 election have significant implications for the
support that President Reagan's economic and fiscal program is likely to command among voters
during the next few years. If Carter and the Democrats were defeated because of a substantial
ideological shift in the electorate away from welfare-state liberalism, then President Reagan's
program of substantial reductions in federal social expenditure and taxation is squarely
consistent with the new distribution of voter preferences and, consequently, should enjoy
sustained, widespread support in the mass public. On the other hand, if the Democrats' defeat in
1980 stems primarily from the high inflation, high unemployment, and low growth experienced
during the later part of the Carter administration, then President Reagan's "economic recovery"
program must significantly improve America's macroeconomic performance (and not simply
reduce federal social expenditures and redistribute income away from lower-income groups) in
order to remain politically viable in the years ahead. As will be seen, evidence concerning the
sources of the Republicans victory as well as events since Mr. Reagan's inauguration support the
latter view. [7]
The macroeconomic history of the Carter administration looks like the stylized "political business cycle" run backward. [8] Having inherited a 7.7% rate of unemployment from the Ford administration--a hangover from the terrible 1974-1975 recession--the Carter administration pursued stimulative macroeconomic policies throughout 1977and into 1978. The policies succeeded and helped lower unemployment by almost two percentage points between the end of 1976 and the beginning of 1979. However, inflation accelerated steadily in 1977 and 1978 and ratcheted upward even more in 1979 following the second big round of OPEC petroleum price increases. This prompted the Carter administration in late 1978 to abandon the liberal Democratic goal of moving the economy toward full employment and to implement restrictive monetary and fiscal policies designed to put downward pressure on the inflation rate. The policy shift created an election-year recession, but because of the sluggish response of wages and prices to economic slack, the inflation rate declined only slightly during the last two quarters of 1980 from its midyear peak. Consequently, President Carter and the Democrats went before the electorate in 1980 with the worst of all possible situations--high inflation, increased unemployment, and falling real income and output.
It is no surprise that President Carter was the first elected incumbent to be defeated in a reelection bid since Hoover in 1932: Carter had the worst election-year economic record since Hoover. In 1980, for example, for the first time since 1932 the year-on-year growth rate of real output and income was actually negative. This is one important reason why President Carter's Gallup poll approval rating plummeted in July 1980 (the trough of the 1980 recession) to 21%; the lowest level recorded since the Gallup organization began polling in the 1930s during the Roosevelt administration.
The Carter administration's economic performance record is contrasted more systematically to that of other postwar administrations in Table 1. We know that mass political support for the president (as registered in the Gallup polls) is influenced by the unemployment rate, the Consumer Price Index inflation rate, and the per capita real personal disposable income growth rate, and so these variables are shown in the table. The combined economic record displayed in the fourth column of the table is simply the sum of the real income growth rate minus the inflation and unemployment rates (R-P-U). This computation is sensible because, averaged over all voters, the three economic variables have been shown in empirical work to have approximately equal weight on support for the president, with inflation and unemployment, of course, being negatively signed (see Hibbs, 1982a).
The first, left-side entry under each column in Table I shows the election-year economic record.
Although the sustainable unemployment rate and the core inflation rate have shown an upward
trend in the postwar American economy, it is obvious that Carter's record was an especially poor
one. Compared to the election-year records of other administrations, Carter's inflation and rea l
income growth rate performances were by far the worst, and his election-year unemployment
ratewas more favorable only than that of Ford in 1976. The Carter administration's combined
election-year record shown in column 4.of the table therefore registers the least favorable score
by a wide margin.
TABLE 1Election-Year and Cumulative Economic Performance Records of Postwar Presidential Administrations | ||||||||
| Administration(election year) | Unemployment(U) | CPI Inflation Rate (P) | Personal Income Growth Rate (R) | Economic Record(R-P-U) | ||||
| Election Year | Average | Election Year | Average | Election Year | Average | Election Year | Average | |
| Truman (1952) | 3.02 | 3.59 | 2.26 | 3.22 | 1.07 | 1.80 | -4.21 | -5.01 |
| Eisenhower (1956) | 4.12 | 4.32 | 1.46 | 1.36 | 3.12 | 2.63 | -2.46 | -3.05 |
| Eisenhower (1960) | 5.54 | 5.51 | 1.50 | 1.36 | 0.82 | 1.03 | -6.22 | -5.84 |
| Kennedy (1964) | 5.16 | 5.46 | 1.31 | 1.14 | 5.51 | 4.72 | -0.96 | -1.87 |
| Johnson (1968) | 3.56 | 3.75 | 4.12 | 3.75 | 2.85 | 2.60 | -4.83 | -4.90 |
| Nixon (1972) | 5.58 | 5.56 | 3.27 | 3.67 | 3.38 | 3.14 | -5.47 | -6.09 |
| Ford (1976) | 7.67 | 7.48 | 5.56 | 6.36 | 2.27 | 1.37 | -10.97 | -12.47 |
| Carter (1980) | 7.15 | 6.55 | 12.67 | 10.33 | -3.25 | -0.78 | -23.08 | -17.66 |
Since political support is based on an administration's cumulative performance and not just on its election-year record [Hibbs, 1982a, 1982b], [9] the second, right-side entry for each column of the table gives a weighted average of the economic performance outcomes for the 15 preelection quarters of each presidential term, starting from the quarterly outcome nearest to the election (the July-September quarter) and going backward to the first. [10] However, the message conveyed by the cumulative, weighted average performance records does not differ substantially from that of the raw election-year records. Looking backward from the preelection quarter over the period 1980:3 to 1977:1, Carter's cumulative real income and inflation records were the worst and his cumulative unemployment record was the second worst of any postwar administration. Given the Carter administration's dismal combined cumulative record of -17.7, it would have been surprising had Carter not lost the election. The only other sitting president to be defeated in a reelection bid-- Ford in 1976--also had a distinctively poor macroeconomic record With the exception of Carter's combined records, both the election-year and cumulative combinedperformance score of the Ford administration (- I l and --12.5, respectively) are substantially less favorable than the others.
The impression left by the statistical data in Table 1--that the economic record suffices to
explain the Democrats' losses in 1980--is reinforced by predictions of several statistical models.
In articles cited earlier I reported evidence indicating that a president's approval rating in the
Gallup pol lresponds systematically to unemployment, inflation,and the real income growth rate,
and that the collapse of the economy during the last two years of the Carter administration
accounted for the deterioration of Carter's Gallup ratings. Although Gallup approval ratings are
not electoral outcomes, they do correlate highly with the vote shares received by incumbents
running for reelection, as well as with the vote shares of nonincumbent nominees of the
president's party. For all presidential elections from 1952 through 1976 the linear equation best
describing the relationship between the two-party percentage of the vote received by the
incumbent party's nominee (V) and the preelection quarterly Gallup percentage approval rating
of the President (Approve) is: [11]
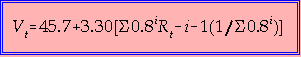
V(t) = 33.3 + 0.373 Approve
[1]
President Carter's preelection, third quarter 1980 Gallup approval rating was 33.3%. By equation I the predicted two party vote share for Carter in the 1980 election therefore is 45.7% [33.3 + (0.373 x 33.3)]; only 1.1% away from his actual two-party share of 44.6% and nearly two full standard errors lower than the 1952-1976 mean presidential vote share of 53.3% received by nominees of the incumbent party.
A second, more straightforward way of assessing the predictability of President Carter's defeat from the economic record of his administration is to examine the 1980 presidential election outcome in light of the historical association between the vote share received by the incumbent party's candidate and macroeconomic performance. The structure of the American political economy has changed profoundly from the prewar to the postwar period, and therefore it is sensible to confine the analysis to elections from 1952 onward. However, since the political effects of unemployment, inflation, and the real personal disposable income growth rate cannot be estimated reliably from only eight presidential election observations, the estimation equation includes only real income growth performance. [12]
Below is the equation best describing the association of the two-party vote share (in percentage
points) of the incumbent party's candidate for president (V) and the (geometrically) weighted
average of the (OPEC adjusted) annualized quarter-onquarter percentage rate of growth of real
personal disposable income per capita(R) cumulatedover the 15 preelection quarters in each
administration: [13]
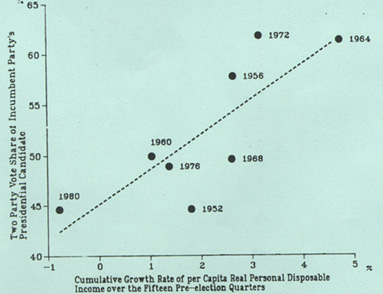
Figure I shows a scatterplot of the vote share and cumulative real income growth rate data along
with the regression line implied by equation 2. The regression line prediction for President
Carter's two-party vote share is 42.5%, which is 2.1% below the 44.6% he actually received. The
regression results reinforce the point that in view of past experience, any incumbent candidate
with a cumulative real income growth rate record as poor as Carter's would be expected to
lose--and lose badly. Notice also that the regression line in Figure I yields large overpredictions
(negative residuals) for the Democratic (incumbent party) candidates in 1968 and especially in
1952. Clearly the U.S. involvement in the Vietnamese and Korean civil wars--each of which
ultimately became extremely unpopular and each of which of course is not taken account of by
the simple economic performance model of equation 2--helped produce a vote for the
incumbent party's presidential candidate lower than would have been anticipated from the real
income growth rate record alone. Indeed, the regression line shown in Figure I suggests that had
the United States not become involved in the Korean and Vietnamese conflicts during the
Truman and Kennedy-Johnson presidencies, respectively, the Democrats may well have won
both the 1952 and 1968 elections. (Recall that prominent Republican campaign appeals in 1952
and 1968 were Eisenhower's pledge to "go to Korea" and Nixon's "secret plan" to end the
Vietnam War, respectively). In other words, based on the incumbent party's cumulative real
income growth rate record alone, Stevenson in 1952 and Humphrey in 1968 perhaps "should"
have been winners . [14]
The main point to be emphasized from equation 2, however, is that the incumbent party's presidential candidate typically can expect to receive about 45.7% of the vote plus a percentage approximately equal to 3.3 times the administration's geometrically weighted cumulative per capita real personal disposable income growth rate record. Therefore, barring major noneconomic developments salient to the electorate (such as our military involvement in Korea and Vietnam), postwar candidates of the incumbent party could anticipate receiving a comfortable majority of the presidential vote--say 52%Äif during the 15 preelection quarters the annualized quarter-on-quarter per capita real income growth rate was maintained at about 1.6% [(52 - 45.7) / 3.3 = 1.7]. Because voters weight performance outcomes close to the election date much more heavily than outcomes earlier in the term (as note 10 shows, for g = 0.8 the weight given to the outcome in the pre-election quarter is nearly 20 times larger than weight given to the outcome during the first quarter of the administration), a strong election year economic record will compensate for truly miserable performance during the first couple of years of an administration. Or, conversely, miserable performance near the election will neutralize a very favorable record earlier in the term. In any case not one postwar cand idate of the incumbent party was successful when the cumulative, geometrically weighted average real income growth rate was under 1.7%. President Carter's problem was that the disastrous 1979-1980 performance swamped the favorable growth record of 1977-1978. Nixon's first election bid in 1960 was unsuccessful because the strong performance of 1959 was insufficient to neutralize the political consequences of the 1958 and, especially, the 1960 recessions during the Eisenhower administration. In President Ford's case, even though election year outcomes are weighted more heavily than the earlier record, the favorable 1976 growth rate was simply not great enough to overcome the political fallout from the deep recession of 1974-1975, which at the time was the worst contraction in postwar U.S. history.
A parallel statistical analysis of the expected popular vote for the president's party in on-year
congressional elections also yields results indicating that nothing was unusual about the
Democrats' 1980 losses. Following Edward Tufte, a sensible measure of congressional election
outcomes is the Standardized Vote Loss or Gain (SLV) of the president's party, which is defined
as the nationwide House vote percentage for the party of the president in the t th election minus
that party's average popular vote percentage in eight prior congressional elections [Tufte, 1978:
chap. 5]. Equation 3 reports the results for the regression of the standardized vote loss on the
(OPEC adjusted) cumulative growth rate of per capita real personal disposable income: [15]
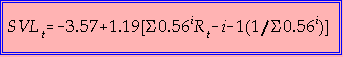
Equation 3 indicates that each percentage point change in the cumulative growth rate record for per capita real personal disposable income typically has been associated with a change of 1.2% in the national vote for the incumbent party's House candidate. Given a "swing ratio" (the change in party seat shares accompanying a given change in House popular vote shares) that for recenton-year congressional elections has been estimated to fall between about 2.0 and 2.5, [16] this means that each sustained percentage point change in the annualized, quarter-on-quarter real income growth rate translates into a 2.4-3.0 point shift in the percentage of House seats going to the party controlling the presidency. For example, in the case of the Democrats in 1980 this meant that each sustained percentage point decline of the real income growth rate had an implicit political price tag (political shadow cost) of between 10 and 13 House seats. Furthermore, the constant in equation 3 of -3.6 implies that in order for the president's party to obtain a House vote share in a given on-year election equal to its long-run average (the mean of eight prior House elections), the cumulative, weighted average real income growth rate must be in the vicinity of 3% [3.6 = 1.2 x 3.0].
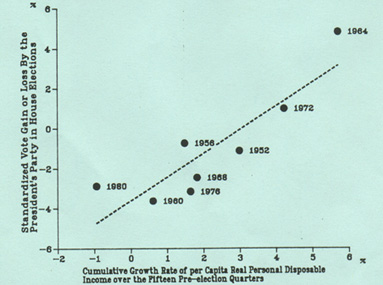
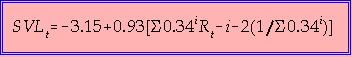
In 1980 the Democrats were saddled with a cumulative real income growth rate record of
-0.94% (given g = 0.56). As illustrated in Figure 2, this yields via equation 3 an expected
standardized vote loss of about 4.7% (SVL = -4.7). In fact, the Democrats' standardized (and
actual) vote loss was just under 3 percent in 1980, which, in light of the Carter administration's
economic record, was perhaps a fortunate result . [17] Nonetheless, it is clear that in the 1980
House races a sizable aggregate shift in the popular vote against Democratic candidates was to
be expected from economic conditions during the Carter years.
Some readers may find arguments based on statistical relations among aggregate electoral and economic data less than completely convincing. However, the evidence from survey interviews of large numbers of individual voters are fully consistent with the conclusions drawn from the aggregate statistical models presented above.
As in 1976, there is little doubt about the preeminent status of macroeconomic issues with voters in the 1980 election. For example, Gallup poll data show that in 1980 more than three quarters of the public mentioned one or more economic issues as "the most important problem facing the country today.- By contrast, only about 12% of the Gallup respondents identified other domestic social and political issues, or international issues, as among the nation's most important problems (see the data reported in Hibbs, 1982c: Fig. 1). Interviews conducted by the CBS News/ New York Times survey organization with more than 12,000 actual voters in selected precincts as they left the polls tell a similar story.
Table 2 shows data from the CBS News/New York Times interviews on the issues most
important to Reagan voters Clearly, neither social and "moral" questions--the Equal Rights
Amendment and abortion--nor international issues--the crises m Iran and U.S. international
prestige--weighed heavily on the minds of many Reagan supporters. This implies that the
influence of antifeminist groups and the "right-to-life" and "moral majority" movements in the
general election was quite small, [18] notwithstanding all the publicity their activities received
and all the money such groups raised. [19] Instead, the great economic issues of inflation and
unemployment and the fiscal issue of the federal deficit (undoubtedly because many people see
deficit spending as an important cause of inflation) dominated the attention of Reagan voters.
The only issue directly touching a right-wing ideological chord--the question of federal tax
reduction--was designated as an important influence by only 13% of the Reagan voters, putting it
in fifth place among the significant issues. SOURCE: CBS News/New York Times 1980
Election Day Poll, reported in the National Journal (August 11, 1980), p. 1877.
Table 2Issues Underlying the Support for Reagan in the 1980 Election | |
Which (of the listed) issues were most important in affecting how you voted todlay (for Reagan)? [two responses permitted] | |
| Inflation and the Economy | 40% |
| Balancing the Federal Budget | 26% |
| Jobs and Unemployment | 20% |
| U.S. Prestige around the World | 19% |
| Reducing Federal Income Taxes | 13% |
| Crisis in Iran | 9% |
| ERA and the Abortion Issue | 5% |
| Source: CBS News/New York Times 1980 Election Day Poll; reported in National Journal (August 11, 1980), p. 1877. | |
These data are compatible with other survey results showing that government spending and
service programs continue to enjoy widespread public support. For example, in the 1980
General Social Survey only 33% of the public thought that "the government should provide
fewer services in order to reduce spending." Overwhelming majorities held the view that we are
spending either "too little--or "about the right amount" on such major social program areas as
health (92%), education (90%), solving the problems of big cities (76%), drug addiction (92%),
improving the conditions of blacks (74%), and crime (94%). Similarly the January 1981 CBS
News/New York Times poll found that 72% of the public would like to see federal spending
"increased or kept about the same" for benefits to college students; 72% also held this view for
unemployment compensation, 77% for controlling pollution, 75% for mass transit, 81% for
highways, and 89% for social security cost-of-living benefits. [21] Only the food stamp
program--whose abuses had been well publicized during the Carter administration--did not
attract strong majority support in the CBS News/New York Times poll: 47% of the public
thought spending on this program should be decreased and 47% thought spending should remain
the same or be increased.
Table 3Qualities Underlying Reagan's Personal Appeal in the 1980 Election | |
| Which (of the listed) Qualities Best Describe Your Choice (of Reagan)? [two responses permitted] | |
| It's time for a change. | 38% |
| He's a strong leader | 21% |
| He's my party's candidate | 12% |
| He impressed me during the debate | 10% |
| I like his Vice President | 9% |
| He has honesty and integrity | 9% |
| His experience in government | 6% |
| Source: CBS News/New York Times 1980 Election Day Poll, reported in the National Journal (August 8, 1980), p. 1877. | |
The personal qualities selected by Reagan voters as reasons for their choice also reveal little evidence of ideological voting in 1980. Table 3 shows the pertinent data from the CBS News/New York Times election day survey. The most striking feature of these data is that only 11% of the Reagan voters listed his conservatism as a reason for their choice. Rather, voters' sense that it was "time for a change" and their perception that Reagan was "a strong leader" were identified as the decisive factors. In light of the economic mismanagement of 1979-1980 and Jimmy Carter's well-developed capacity to appear vacillating and ineffective, It IS hard to argue that such judgments were inaccurate or unreasonable. Small wonder, then, that when the public was asked to evaluate comparatively the performance of the last eight presidents (Roosevelt to Carter) in the January 1981 Harris poll, only 2% thought Carter "was best on domestic affairs" and fully 44% thought he "was least able to get things done." [22] In any case, there IS no sign from the data in Tables 2 or 3 that support for Reagan reflected a dramatic surge in conservative political orientations among voters.
Recent trends in the ideological distribution of the electorate identified by various national
surveys confirm this interpretation. Table 4 reports the relevant data. Although the various
surveys used different question wordings and scales to assess the electorate's ideological
orientation, the data in Table 4 show clearly there was no great ideological shift in 1980. The
SRC National Election Studies indicate considerable stability in the distribution of ideological
orientations since 1972. Compared to earlier years, the only distinguishing feature of 1980 in the
SRC data is the 5% to 7% shift out of the neutral-moderate group into a residual ideological
category (which is not shown in the table). The Gallup polls suggest there has been a decline of
perhaps 8 points in the percentages of the electorate viewing themselves as liberal and
conservative, and a corresponding growth in the percentage of middle-of-the-roaders. The
General Social Surveys show a gradual decline in the fraction of self-identified liberals and a
growth in the fraction of conservatives of between 4 and 5 percentage points from 1974 to
1980--hardly the stuff of a major change in the political composition of the electorate. Survey
evidence favoring the idea that the 1980 election represents a realignment of ideological
commitments is therefore almost nil.
Table 4Recent Trends in the Ideological Distribution of the Electorate | |||||
| SRC National Election Studies | |||||
| 1972 | 1974 | 1976 | 1978 | 1980 | |
| Liberal | 19% | 23% | 16% | 20% | 17% |
| Moderate | 27 | 26 | 25 | 27 | 20 |
| Conservative | 27 | 24 | 25 | 28 | 29 |
| Gallup Polls | |||||
| Liberal | 27% | --- | 20% | --- | 19% |
| Moderate | 34 | --- | 47 | --- | 49 |
| Conservative | 39 | --- | 33 | --- | 31 |
| General Social Survey | |||||
| Liberal | --- | 31% | 29% | 28% | 26% |
| Moderate | --- | 40 | 40 | 38 | 41 |
| Conservative | --- | 30 | 31 | 34 | 34 |
| Sources: Miller, et al. (1980:95) and ICPR, Election Study Codebooks, for SRC surveys; Roper Center (July 1980:70) for GSS surveys: Public Opinion (Feb., Mar., 1981:20) for Gallup surveys. NOTE: Question wordings and ideological scales vary. | |||||
The implications of equation 2 and figure 1, tying Carter's defeat to his administration's
economic performance, are supported by other survey results bearing more directly on the 1980
presidential contest. The data in Table 5 show the division of the vote among voters who
reported their family financial situation as having become better, stayed the same, or become
worse over the election year. [23] Since data are available for 1976 as well as 1980, and
because Jimmy Carter was a candidate in both elections, the survey results reveal the outcomes
of a quasi-experiment.
Table 5Family Financial Situation and the Vote for President,1976 and 1980 | |||
| 1976 | Better | Same | Worse |
| Carter | 30% | 51% | 77% |
| Ford | 70 | 49 | 23 |
| TOTAL | 100% | 100% | 100% |
| (N) | 3262(23%) | 6924
(49%) |
3908
(28% |
| 1980 | Better | Same | Worse |
| Carter | 53%/59% | 46%/50% | 25%/28% |
| Reagan | 37/41 | 46/50 | 64/72 |
| Anderson | 8 | 7 | 8 |
| TOTAL | 100% | 100% | 100% |
| (N) | 1841
(18%) |
4602
(44%) |
3911
(38%) |
| Source: CBS News/New York Times election day interviews with voters as
they left the polls, reported in the New York Times (Nov.9, 1980).
Note: Right-side entries give two party vote shares, exculding Anderson. | |||
In both elections the economy was the dominant issue. In 1976 Carter was the challenger attacking Ford's economic record. The challenge was successful, and in 1980, as the incumbent, Carter had to defend his record against the major challenge from Reagan and the nuisance factor posed by Anderson's independent candidacy. [24] Table 5 shows a great symmetry across the two elections in the success of challengers and incumbents among voters with venous economic experiences prior to the election. Among survey respondents reporting a stable family financial situation during the year preceding the election, both the 1976 and 1980 vote split evenly between the challenger and the incumbent. As the challenger in 1976, Carter received more than three-quarters of the votes from those perceiving a deterioration in their economic situation, but he won less than a third of the votes from those claiming an improvement in their economic situation. As the challenger in 1980, Reagan did about the same. He attracted more support among voters feeling better off financially than Carter had in the previous election (41% versus 30%), but he did somewhat poorer than Carter had among voters feeling worse off (72% versus 77%). Looking at the data in another way, in 1980 Carter as incumbent was somewhat more successful than Ford had been in 1976 with voters who perceived their families as being worse off financially (28% versus 23%), but Carter was less successful with voters who felt better off economically (59% versus 70%).
The principal lesson to be drawn from Table 5, however, is that Reagan's success in 1980 among voters reporting various economic experiences is about what one would expect of a credible challenger in an election where, as in 1976, the economy was the most salient issue. Since both the cumulative and election-year economic records of the Carter administration in 1980 were less favorable than the Nixon-Ford records in 1976 (see Table 1), fewer voters felt better off (18% versus 23%) and more voters felt worse off (38% versus 28%) during the Carter-Reagan contest than during the Ford-Carter race. And this is the main reason that Reagan defeated Carter by a (relative) margin larger than Carter's victory over Ford four years earlier.
As Orren and Dionne (1981) recently noted, there is considerable irony in the fact that Carter's defeat has been interpreted as a sign of the political collapse of welfare-state liberalism. For in the context of his times, Jimmy Carter was probably the least liberal Democratic president in this century, and he lost the election not because of his liberalism but because he pursued conservative anti-inflationary policies that produced an election year recession on top of severe inflation. The victim of this irony was one of the most enduring public perceptions in American political life: the idea that the Democrats are the party of prosperity and high employment. Thanks to the legacy of the Great Depression, which was sustained by the 1953-1954, 1957-1958, and 1960 recessions during the Eisenhower years, the 1969-1970 recession during Nixon's first term, and by the terrible 1974-1975 contraction during the Nixon-Ford administration, when Jimmy Carter was elected president in 1976 the Democratic Party enjoyed its traditional advantage over the Republicans as the party voters saw as best equipped to manage the economy. [25] The 1976 SRC National Election Study, for example, showed that among voters who saw a difference in the parties" effectiveness managing the economy (not quite half the electorate), Democrats were considered better able to handle the unemployment problem by a factor of nearly 4 to I (36.4% to 9.5%). The Democrats even led the Republicans as the party seen as more likely to better handle inflation by 28% to 19%. Four years and one Carter induced recession later, these Democratic advantages were gone. In the 1980 preelection SRC survey the Republicans enjoyed a 2 to I advantage over the Democrats as the party seen as likely to better handle inflation (31% to 15%), and led the Democrats as well in response to the question about which party would better handle unemployment (23% to 19%). [26]
By featuring his economic and fiscal plan as a "program for economic recovery" [27] President Reagan struck a responsive political chord. Indeed, the packaging and promotion of the president's program after the 1980 election exhibits political deftness not seen in Washington since Lyndon Johnson's successes with his Great Society legislation in the mid 1960s. The president's program includes a substantial reduction of federal civilian expenditure and a significant reduction in federal personal taxation rates, skewed toward the upper income groups. As intended, these changes will certainly yield a shift in the composition of aggregate output and consumption away from th public sector to the private sector, and a shift in the distribution of Income away from low- and middle-income groups (especially the working poor) to the higher-income classes. [28] But the president has no mandate for these distributional changes in the political economy. In order to remain politically viable, the program must, as advertised, also produce a substantial economic recovery. On this foundation rested the electorate's considerable initial goodwill toward the president. If the Reagan program does eventually generate higher growth, lower unemployment, and lower inflation, or is at least correlated in time with a sharp improvement in America's macroeconomic performance, the president probably will succeed in crystallizing a popular base for "Reaganomics" that might well last a generation or more. But tangible economic improvement there must be--and quickly. As Lawrence J. DeNardis, a freshman Republican congressman from Connecti cut who backed the Reagan program, put it less than eight months into his term: "My constituents are willing to wait a respectable period of time. But a little edge is beginning to emerge If t his doesn't work, they're going to hang me" (quoted in Roberts, 1991).
Congressman DeNardis's problem--and, more significantly the problem of the Reagan administration and the Republican party as a whole--is that Reaganomics at the time of this writing (May 1982) has produced a near catastrophe in the American macroeconomy. Under Chairman Paul Volker's leadership and with the administration's encouragement, the Federal Reserve has pursued a truly Draconian monetary policy. The combination of extremely tight money and credit and unprecedented current and projected future budget deficits [29] has led to skyrocketing interest rates. The consequences are shaping up to be the most severe recession since the 1937-1938 contraction during the Great Depression. Since President Reagan's inauguration the unemployment rate has risen two full percentage points--from 7.4% in January 1981 to 9.4% in April 1982--which is the highest level recorded since 1941. Real income and output have been stagnant or declining. Real personal disposable income per capita was virtually the same in the first quarter of 1982 as it was in the first quarter of 1981 ($3225 in 1967 dollars) and real GNP was 2.2% lower in the first quarter of 1982 than it was when Reagan assumed office. The recent trajectory of aggregate output is especially frightening: real GNP fell 5.4% in the fourth quarter of 1981 and again by 5.2% in the first quarter of 1982.The only bright spot has been inflation, particularly as measured by the much maligned Consumer Price Index (CPI), which rose by 10.3% over 1981-1982 (as compared to an increase of 13.5% in Carter's last year) and by an annual rate of only 3.1% during the first quarter of 1982. [31]
However, if empirical studies of the impact of economic performance on presidential and congressional voting outcomes reliably guide the future, the administration's real income (and unemployment) record will be far more important to voters than its inflation record, and therefore President Reagan and the Republicans are in serious trouble. Certainly this is the message from the polls. President Reagan's approval ratings in the Gallup polls, after peaking at 67-68% in March-April 1981, have eroded steadily, falling to 43% in the April 23-26, 1982 survey (the most recent poll available to me). Of all presidents from Eisenhower to Reagan, only President Carter experienced a decline this large--about 25 percentage points--in Gallup poll approval ratings during the first five to six quarters in office.
Voter support for Republicans in the House of Representatives also has fallen to a perilously low level. In the April 2-5, 1982 Gallup poll only 34% of the registered voters said they would vote Republican "if the elections were held today." [32] Statistical models also indicate that the Republicans are likely to suffer a large decline in their popular vote share and a correspondingly large loss of seats in the 1982 mid-term congressional elections. [33] Forecasts based on two models are reported in Table 6.
Table 6Forecasts of Republican Vote and Seat Losses inthe 1982 House Elections | ||
| Model | Prediced GOP Vote Loss | Predicted GOP Seat Loss |
| Hibbs | - 5.0% | - 39 |
| Tufte (Gallup Approval Rating Assumed for Regan | ||
| 48% | - 6.0% | - 34 |
|
43% |
- 6.6% | -37 |
|
38% |
- 7.2% | - 41 |
| Predicted vote share losses equal predicted SVL plus 46.2 minus 48.6 | ||
The predictions from the "Hibbs" model in the top half of Table 6 are based on an equation
estimated for mid-term congressional outcomes from 1946 to 1978 in which the best fit for the
Standardized Vote Loss (SVL) of the president's party in the House was generated by a
geometrically weighted average of annualized, quarter-on-quarter growth rates of real personal
disposable income per capita (OPEC adjusted) from the first to the sixth quarter of each
Presidential term:
 [4]
[4]
When predicting the 1980 Republican (two-party) House vote share from equation 4, the 1982 second quarter real income growth rate (not available at this writing) was set equal to the latest available Data Resources Inc. forecast (+0.6%). Under this assumption the predicted Republican vote share is 43.6%, [34] which implies a vote share loss of 5.0% from the 48.6% the Republicans received in the 1980 House elections.
The Seat loss projection from equation 4 is based on the "swing ratio" equation (estimated for
mid-year elections 1946-- 1978):
 [5]
[5]
where S is the change (from the preceding on-year election) in the percentage of House seats held by the president's party after mid-term elections, and V is the change in the (two-party) percentage of the popular vote in House contests (from the preceding on-year election) received by the president's party after mid-term elections. If equation 5 yields an accurate guide to the shift in the seat share accompanying a given shift in the vote share in 1982, then for a Republican vote loss of 5.0% (from equation 4) we have a projected Republican seat loss of about 39 [39 (-5.0 x 0.0234 + 0.0282) x 435].
The remaining forecasts in Table 6 are based on Tufte's well known model for the expected Standardized Vote Loss of the president's party in mid-term congressional elections (see Tufte, 1978: chap. 5). In Tufte's model SVL is a linear function of the election-year percentage change in per capita real personal disposable income (RA) and the president's average September-- October Gallup approval rating (Approve) in the election year. The most recently available ordinary least-squares estimates of Tufte's equation for mid-term elections from 1946 to 1978 (supplied to me by Tufte) are: [35]
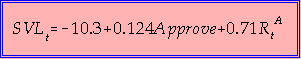
Forecasts from Tufte's model depend on the assumption made about the 1982-1981 per capita real personal disposable income growth rate and on President Reagan's Gallup approval rating in September-October 1982. Concerning the former, all forecasts based on this model in Table 6 incorporate the Data Resources Inc. forecast of the 1982-1981 growth rate of RA: +1.07%
Three alternative assumptions are made about President Reagan's September-October Gallup approval rating. One is that the president's approval rating will remain at its current (April 23 - 26, 1982) level--43%.%. In conjunction with the real income growth rate assumption described above, this yields a predicted vote loss of 6.6 percentage points and an associated seat loss projection based on Tufte's estimate of the 1982 swing ratio of 1.3 (conveyed to me privately), of 37. If the president's approval rating increases from the April level by, say, 5 points to 48%, the vote loss predicted by Tufte s model is about 6.0%, and this implies a seat loss (given a swing ratio assumption of 1.3) of 34. If, as is more likely, the president's approval rating declines from its April level, for example, by 5 points to 38%, Tufte's model predicts a Republican vote loss of 7.2 percentage points, which yields a corresponding seat loss projection of 41.
Naturally, if the per capita real personal disposable income growth rate is more favorable than the values I have assumed, or if the swing ratios are lower than those used here, or in the case of the Tufte model predictions, if the president's approval rating rises dramatically, the vote (and seat) loss forecasts shown in Table 6 would be commensurately smaller. (The reverse, of course, would be true if the assumptions underlying the forecasts In Table 6 were too optimistic from the Republicans' point of view.) Yet past experience (as summarized by simple statistical models) indicates that the Republicans will absorb a decline in their House strength in 1982 rivaling their 1974 losses. [36]
The prospects for President Reagan (or, if he does not seek reelection, an alternative Republican nominee) in the 1984 presidential election are altogether a different matter. Voters appear to weight current performance much more heavily than past performance when making contemporaneous political judgments, and therefore the 1984 presidential (and congressional) election result(s) will depend greatly on the administration's performance in periods after the mid-term elections. For example, if the lag parameter g, which defines the relative weight given current and past performance outcomes, Is on the order of 0 8 as equation 2 and Hibbs (1982a, 1982b) indicate, then election-year performance outcomes will receive about 50% of the lag weight total and outcomes during 1983 and 1984 will receive about 80% of the total weight. [37]
Nonetheless, the electoral success of President Reagan and the Republicans in 1984 does hinge
on an improvement--in fact, a very sharp improvement--in current economlc conditions.
Although the likely Republican losses in the upcoming congressional races may well stimulate a
pronounced shift toward an expansionary macroeconomic policy (especially monetary policy),
thus far the administration's response to the dismal macroeconomic situation is perhaps best
described as "stonewalling. [38] Yet if the economy does not register dramatic improvement
over the next two years, Reaganism and Reaganomics will no doubt be interpreted, in hindsight,
not as a reflection of a fundamental "shift to the right" but as a one-term political aberration.