Using Project  Vote Smart
STEP 1. CLICK on the link to
Project Vote Smart to begin.
This may not be, or it may not look exactly like the Home Page of Project
Vote Smart. Project Vote Smart has been altering their Home Page to make
announcements, solicit workers, and solicit funds. If this is not the
first page, then click on the link to go to Home Page.
STEP 2. CLICK on "Current Elected Officials" at the top of the page
STEP 3. Click on "Congress from the drop-down menu
STEP 4. Select "California" from the drop-down menu
and CLICK on "GO"
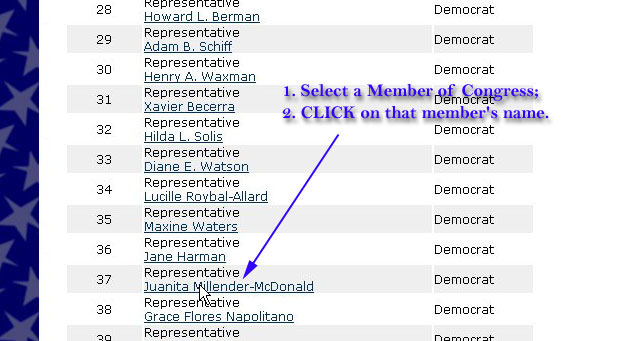
STEP 5. Select a Member of Congress
 Using Project
Vote Smart
Using Project
Vote Smart
to Obtain Special Interest Group Ratings of Members of
Congress
STEP 6. CLICK "Special Interest Groups"
STEP 7. Select a Special Interest Group catagory
Select one special interest group in this catagory and record the Special
Interest Group rating for this Member of Congress (and all the other
Members of Congress you are including in your study).
You can also find the data on campaign finance by using Project
Vote Smart.
STEP 8. Under the Member's photo are links; CLICK on "Campaign
Finance"
Another link will appear, CLICK on "Campaign Finance" again.
A window for this member of Congress will open at
www.opensecrets.org (See Step 6 below).
Direction for Using The Center for
 Responsible Politics
to Obtain Campaign Finance Data
STEP 1: Go to "Links" on the Political Science 100 Web Page
STEP 2: Select "Members of Congress", and then
select the 108th Congress--"list by state".
STEP 3: Scroll down to "California".
STEP 4: Click on the name of a Member of Congress.
STEP 4: Select the following information to put in a table on
campaign finance or your paper:
- Total Receipts Collected: you will use this dollar
amount to calculate the average cost to run for Congress from
California.
- Source of Funds: report the percentage of
funds collected from individuals and from Political Action
Committees in a table to compare Democrats and Republicans.
- Source of PAC Contributions: report the
percentage of PAC contributions from business PACs, labor
PACs, and Ideological/Single Issue PACs in a single table to
compare which PACs contribute to Democrats and which PACs
contribute to Republicans.
STEP 5: Use this data to generate two tables:
- Percentage of Campaign Contributions from Individuals and
PACs;
- Source of Campaign Contributions from PACs; and
- an average of the amount of contributions needed to run for
Congress successfully from California.
The data on this page is for the 2004 election. This data
is the most current information available for an entire election cycle
(2003 to 2004).