FMRI Functional Magnetic Resonance Imaging
Lab
In this lab you will read the text below and
the related articles utilizing FMRI and then do the quiz on Beachboard.
What is Functional Magnetic Resonance Imaging or FMRI?
Functional Magnetic Resonance Imaging or FMRI is a
non-invasive technique for imaging the activation of brain areas by different types of physical sensation
(sight, sound, touch, taste, smell) or activity such as problem solving and/or movement
(limited by the machine).
Thus, FMRI scans are an increasingly common tool for "brain mapping" in cognitive
science.
How Are MRI Machines Constructed?
The construction of MRI Machines has evolved somewhat over the
years. Two factors have influenced the development of MRI design; (1) the
desire to enhance image quality and (2) The desire to make the scanners less confining
for the patient/subject. Below are some of the design innovations
introduced to make MRI scanners less claustrophobic and allow the subject more
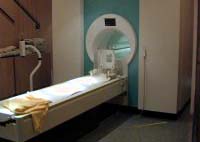
freedom for performing tasks while being scanned. Figure 1 shows a typical
MRI scanner where the subject is nearly enclosed within the long tube of the
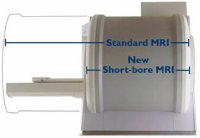
scanner. Figure 2 shows how designers the shortened the scanner
tunnel. Short-bored designs are less claustrophobic for the patient.
These designs ease the sense of confinement, but still limit the subject's
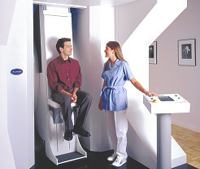
ability to engage in tasks. Stand-up scanners like the one shown in figure
3 are more convenient for patients and allow imaging in the normal attitude and
weight-bearing conditions. The scanner is lowered around the subject, who
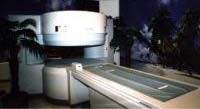
sits on an adjustable seat. Finally, figure 4 shows open MRI scanners,
which allow for a greater range of subject tasks as well as easing the subject's
sense of confinement.
|
|
|
| Figure 1: A typical closed long MRI
Scanner. |
Figure 2: Comparision between long
and short bore MRI scanners. |
|
|
|
| Figure 3: A stand-up MRI scanner. |
Figure 4: An open MRI scanner. |
|
Photos courtesy of Midwest
Diagnostic Management |
Though specifics of design vary, the basic elements of an MRI
scanner remain pretty much the same (See below). The scanner consists of a
large magnet (blue) that creates the primary magnetic field. Magnet strength in MRI systems is measured in units of magnetic flux density called
a "tesla". A telsa is enough magnetic force to induce 1 volt of electricity in a single-coil circuit during 1 second of time for every square meter. 1 tesla is equivalent to 10,000 gauss, another meaure of magnetic force defined as one line of force per square centimeter per second of time. Current magnet strength varies from 0.5-tesla to 2.0-tesla.
However, researchers developed 3-tesla MRI scanners in the late 90's which are becoming more common. To put those numbers in perspective,
the Earth's magnetic field is about 0.5-guass or .000005-tesla. In addition
to the main magnet, there are also gradient coils (red). These gradient
coils are electro-magnetic coils which technicians use to alter the main
magnetic field at very precise points and for very precisely controlled
times. Gradient coils can be changed so as to adjust the machine for the
type of body material to be imaged. Finally, MRI scanners also incorporate
radio frequency coils which can send a focused radio frequency pulse into the
scanner chamber. Technicians can change the radio frequency coils to
adjust for materials and body part.
What's the Difference Between MRI and FMRI?
FMRI scans use the same basic principles of atomic physics as
MRI scans, but MRI scans image anatomical structure whereas FMRI image metabolic
function. Thus, the images generated by MRI scans are like three
dimensional pictures of anatomic structure. The images generated by FMRI
scans are images of metabolic activity within these anatomic structures.
What is Magnetic Resonance?
In order to understand how FMRI scans work one needs a rough
understanding of the basic physical principles upon which the technology is
built. The relevant physical principles are those involving the
atom. Atoms are the smallest particles of an element which still possess
the properties of the elements. For instance, helium is an element. The
smallest bit of helium that still has the properties of helium is a helium
atom. Atoms are very small. The diameter of an atom ranges from about 0.1 to 0.5 nanometers (0.0000000001 of a meter to 0.0000000005 of a meter).
To put this in some context, if we think of the diameter of a single atom as the
length of a meter stick, the corresponding length of the meter stick would be 10
billon meter sticks (approximately 14 round trips to the moon). Despite their diminutive dimensions, atoms are mostly empty space. The nucleus (center) of an
atom has a diameter approximately 1/10,000 that of the diameter of the atom
itself.
Most atoms are composed of three particles distinguished by
their electrical charge: protons (positive), electrons (negative), and neutrons
(neutral). Electromagnetic forces bind protons and neutrons together in an atom to
form its center, i.e, its nucleus. The number of protons in an atom's
nucleus determines the atom's elemental categorization. Hydrogen has
the fewest protons with only one. Uranium has 92 protons. The number
of neutrons is usually approximately equal to the number of protons, but there
is variation in the number of possible neutrons in an atomic nucleus.
Electrons circle around the nucleus. Since protons have a positive
charge and electrons have a negative charge these particles attract each other, thereby creating the stable, electrically neutral structure
of the average atom.
The electromagnetic forces that keep atomic structure relatively
stable by keeping the electrons circling the nucleus also cause the nucleus to
wobble or spin. That is, the nucleus of the atom spins around as in the
above animation. Nuclear spin, or more precisely, the manipulation of
nuclear spin is the basis for MRI imaging. If you follow astronomy,
nuclear spin is similar to the wobble of distant stars used to infer the number,
size, etc. of bodies orbiting the star.
If one places an atom within a magnetic field plane, i.e,
subject it to magnetic forces along two of the three dimensions, then the
nucleus will orbit around the third (vertical) axis. This is called
precession and is depicted in the animation below:
When one causes nuclei to precess their spin will cause them
to align themselves
with the magnetic field. The spin of a nucleus is just like
the ends of a bar magnet in that it can have a positive or negative value.
Two negative or two positive ends of a magnet repel one another, but negative
and positive ends attract each other. Similarly, all the negative spin
atoms align themselves downward on the Z axis (towards the feet of the subject),
and all the positive atoms align upward on the Z axis (towards the subject's
head). Each atom with a positive spin cancels out (renders
undetectable) an atom with a negative spin. There remain, however, a
few atoms that do not cancel one another out. At room temperature, there
are always more positive spin atoms than negative spin atoms. These
unmatched atoms are the important ones for MRI and FMRI.
Positive spin
atoms are in a low energy state. The atoms achieve and equilibrium
magnetization value along the direction of the magnetic field, i.e., the Z
axis. By introducing a pulse of magnetic energy
perpendicular to the main magnetic field in the form of a radio frequency pulse that is specific to the type of atom (usually hydrogen), the
MRI machine causes the unmatched atoms to resonate. Resonating atoms
absorb the radio energy as a photon and go to the higher energy state, i.e., they become
negative spin atoms and the equilibrium magnetization value for the Z axis goes
to 0. When the pulse is stopped, these atoms release their
photon energy and "relax" back into the lower energy positive spin state. The signal
that the MRI machine detects is the photon energy emitted by these unmatched atoms as
they make a transition from the higher energy state to the lower energy
state after the radio frequency pulse. The amount of time it takes for for
the atoms to return to their equilibrium value is called the "spin lattice relaxation time"
or (T1). T1 is, thus, a measure of the half-life of inverted spins.
If the technician uses the gradient magnets inside the MRI to alter the local net magnetization
so that it is in the XY plane (cutting a very thin slice across the patient), the local net magetization rotates the Z axis (takes on positive and
negative X and Y values) at a frequency called the Larmor frequency. The
Lamor frequency equals the frequency of the photon which would cause a transition between the two energy levels of the
nucleic spin. By again introducing a pulse of magnetic energy
in the form of a radio frequency pulse that is specific to the type of atom, the
MRI machine causes the unmatched atoms to resonate. The resonating atoms
absorb the radio energy and go to the higher energy state, i.e., they become
negative spin atoms relative to the XY axis (the transverse axis). The amount of time it takes for for
the atoms to return to their equilibrium magnetization value along XY axis
(transverse axis) is called the "spin-spin relaxation time" or
T2. T2 is, as a result, measures the rate of change of spin phases. Whereas a typical T1 (spin lattice relaxation time) is approximately 1 second, the T2 (spin-spin relaxation time) is usually less than 100ms. This difference in the relative times is what makes T2 better suited than T1 for functional metabolic imaging.
 |
|
Spin-spin relation time T2 |
Particularly important for FMRI is the measure of decay of
transverse magnetization, T2* which takes into account two important factors:
(1) molecular interactions and inhomogeneities in the magnetic field. FMRI creates the images or brain maps of brain functioning by setting up
and utilizing an advanced MRI scanner in such a way that increased blood flow to the activated areas of the brain shows up on
the MRI scans. The MRI scanners do not actually detect blood flow or other metabolic
processes. Rather, blood flow alterations and/or associated
metabolic processes in brain areas are indirectly inferred from the signal intensity
contrast for a given brain
region relative to both normal levels and levels immediately adjacent to the
area in question. The intensity of an MRI signal is determined by the
level of
magnetic resonance, specifically what is called the BOLD effect (blood oxygenation level dependent)
on T2*. Here's how:
Magnetic fields are altered by the presence of
any substance to some extent. Many materials exhibit pronounced polarization
in a magnetic field. The degree of this effect is referred to as the
"magnetic moment" or "magnetic susceptibility". Spatial and temporal
variation in local concentrations of deoxygenated hemoglobin (blood cells not
carrying oxygen or Hb) to oxygenated hemoglobin (blood cells carrying
oxygen or HbO2) result in corresponding changes in magnetic
susceptibility, which in turn cause the local T2* values to fluctuate. Oxygenated
hemoglobin are diamagnetic (i.e.,
tend to take a position at right angles to the lines of magnetic force, and are repelled by either pole of the magnet), while deoxygenated
hemoglobin is paramagnetic (i.e., takes a position parallel and proportional to the intensity of the magnetizing field).
Thus, MRI is able to detect a small difference (a signal of the order of 3%) between the
two types of hemoglobin. This is called a blood-oxygen level dependent, or "BOLD" signal.
Researchers are currently exploring the precise relationship between neural activity and the BOLD signal.
However, the basic story goes as follows:
Blood is delivered to the brain by arties and transported from
the brain by veins. Not only is the actual blood volume relatively low in
the brain, but the majority of blood volume is in the capillary bed--the very
small vessels that connect arteries and veins. Capillaries are often so
small that hemoglobin (blood cells) travel in single file. Whereas arterial blood has a high concentration of oxygenated
hemoglobin as the blood cells pass through the capillary bed, the concentration of
deoxygenated hemoglobin increases relative to oxygenated
hemoglobin. Thus, as indicated in the diagram below, a gradient of highly
oxygenated
hemoglobin to highly deoxygenated hemoglobin runs across the capillary bed from
arteriole to venule. As a result, a corresponding gradient in T2*
values from longer T2* (diamagnetic HbO2-rich) to shorter T2* values
(paramagnetic Hb-rich).
The relevant spatial unit for measuring local T2* for fMRI contrast
called a "voxel".
Voxel comes from the contraction for volume element. A voxel is smallest unit of
MRI reconstruction, and corresponds to a single pixel in an MRI display image.
The relative ratio of deoxygenated to oxygenated hemoglobin within a voxel
determines the T2* value for that voxel. Increases in metabolic function
in a given brain region can trigger vasodilation (expansion of the vessel),
thereby increasing oxygenated blood flow and altering the gradient of highly oxygenated
hemoglobin to highly deoxygenated hemoglobin within the capillary bed. If
one assumes that neuronal activation causes local vasodilatation absent a
corresponding significant increase in oxygen metabolism, then increased oxygenated blood
flow to a brain region results in a corresponding increase in local, intravoxel T2*.
This T2* increase, then, causes a corresponding increase in image intensity.
How Researchers Use MRI Scanners to Expolit the BOLD Effect
The subject in a typical experiment lies or sits in the magnet and the
researcher sets up a particular form of stimulation or task. For example, the subject may wear special glasses so that pictures can be shown during the experiment. Then, MRI images of the subject's brain are taken.
Like PET scans, each of these images are of a single slice of the brain which a
computer combines into a 3-D image. On the first pass, researchers take a
high resolution scan to be used as the backdrop against which the activated
areas will be better differentiated anatomically. Next, the subject begins
that stimulation or task and and series of the lower resolution BOLD scans are taken over
time. BOLD scans are usually repeated every 2-5 seconds. The voxels
in FMRI are approximately 2.5 mm each side.
|
|

|
|
Slices taken in succession |
Series of
slice images of brain
Image Courtesy
of Wikopedia |
Upon completion of the experiment, the computer takes the slice
images from the MRI and uses mathematical transformations and reconstruction algorithms
to render the images and then correct for distortion, subject movement, etc..
The computer compares and accurately maps the the low resolution images
taken during the experiment to the high resolution backdrop. The final image
illustrates areas of activity during the experiment as colored patterns overlaid
upon the original high resolution scan. Researchers can also render the combined activation
slice images into a 3-D images which can be rotated to any angle. For a
really powerful example of how such imaging works look at the mpeg video made
from images of children's brains as they matured: UCLA
Brain Maturation The movie is made from time-lapse imaging constructed from MRI scans of
healthy children from 5 to their 20s. Red indicates more gray matter, blue less gray matter.
The Subtraction Technique for using FMRI for Complex Tasks
In many cases a task that cognitive
scientists wish to study--the target or primary task--also requires that the
brain perform other tasks--the secondary task(s). For example, the verbal
reasoning tasks involve both reasoning alone (target or primary), as well as
language comprehension tasks (secondary task(s)). In order to better isolate the
areas of the brain involved exclusively in the target or primary task while the
brain performs several tasks, scientists perform FMRI scans on subjects during
the performance of two different tasks. The first task represents both the
primary or target task [e.g. reasoning] together with the secondary task [e.g.
language comprehension task(s)]. The second task involves only the secondary
task(s) [e.g. language comprehension task(s)]. Researchers isolate the brain
regions and activity involved in the primary or target task [e.g. reasoning] by
subtracting the first task [e.g. language comprehension task(s)] from the second
task [e.g. reasoning total]. That is, reasoning total = reasoning alone +
language comprehension task(s). So, reasoning total [reasoning alone + language
comprehension task(s)] - language comprehension task(s) = reasoning alone. For instance, in the reasoning studies done by Osherson et al. (1998) subjects performed both reasoning tasks and meaning tasks. Since language comprehension was clearly involved in evaluating the arguments, subjects were asked to perform the meaning tasks
alone. As Osherson et al. express it, "The meaning task required subjects to examine
premises and conclusion individually and determine
whether any had anomalous content; it served as a baseline
condition since no more than sentence comprehension
was involved." (1998, p. 370) The target task--the task of primary interest
necessary includes the secondary meaning tasks. In the case of Osherson et al. subjects evaluated whether arguments were valid or invalid in the deductive logic task. Scientists then subtract the activation patterns in the performance of the secondary only task from the activation patterns during the target task (combined primary and secondary task). The remaining activation is then hypothesized to result exclusively from the primary or target task and not the secondary tasks.
fMRI
Specialty Lexicon
Articles on FMRI (Read before doing quiz)
Some Other Links on FMRI and MRI that are NOT required
http://en.wikipedia.org/wiki/Magnetic_resonance_imaging
http://www.cis.rit.edu/htbooks/mri/inside.htm
http://electronics.howstuffworks.com/mri6.htm
Lab Questions
1.)
True or False: FMRI scans differ from MRI scans in that the latter create highly
detailed pictures of anatomic structure, while the former create images of
metabolic functioning.
2.)
Multiple choice:
What
is measured by the MRI machines thereby allowing them to create an image? The
photonic energy emitted by the relaxing atomic nuclei, The neutrons ejected from
the atomic nuclei, The radio frequency pulse as it is deflected from the atomic
nuclei, or The charmed quarks emitted during atomic decay.
3.)
True or False: FMRI
scans actually directly measure metabolic proccesses.
4.)
True or False: FMRI
scans use both MRI and FMRI scans to generate the final images.
5.)
Short answer: Briefly
explain why scientists often scan people during the performance of two different
tasks?
6.)
Multiple choice: According
to the brain maturation study by Dr. Jay Giedd which is the last brain area to
mature? The extreme front and back of the brain, The parietal lobes,
The prefrontal cortex, or The hippocampus.
7.)
True
or False: Dr. Jay Giedd s study also indicated two periods of overproduction of
gray matter followed latter by pruning of unused connections. The first
overproduction of gray matter occurs during the first 18 months of life was
followed by a steady decline as unused circuitry is discarded. The second wave
of overproduction of gray matter just prior to puberty, followed by a second
bout of "use-it-or-lose-it" pruning during the teen years.
8.)
True or False: According to a UCLA study by Paul Thompson schizophrenia is
associated with a gray matter loss of more than 10 percent first in the
parietal, or outer, regions of the brain, followed by losses that engulf the
rest of the brain over five years. This loss of grey matter begins in the teen
year.